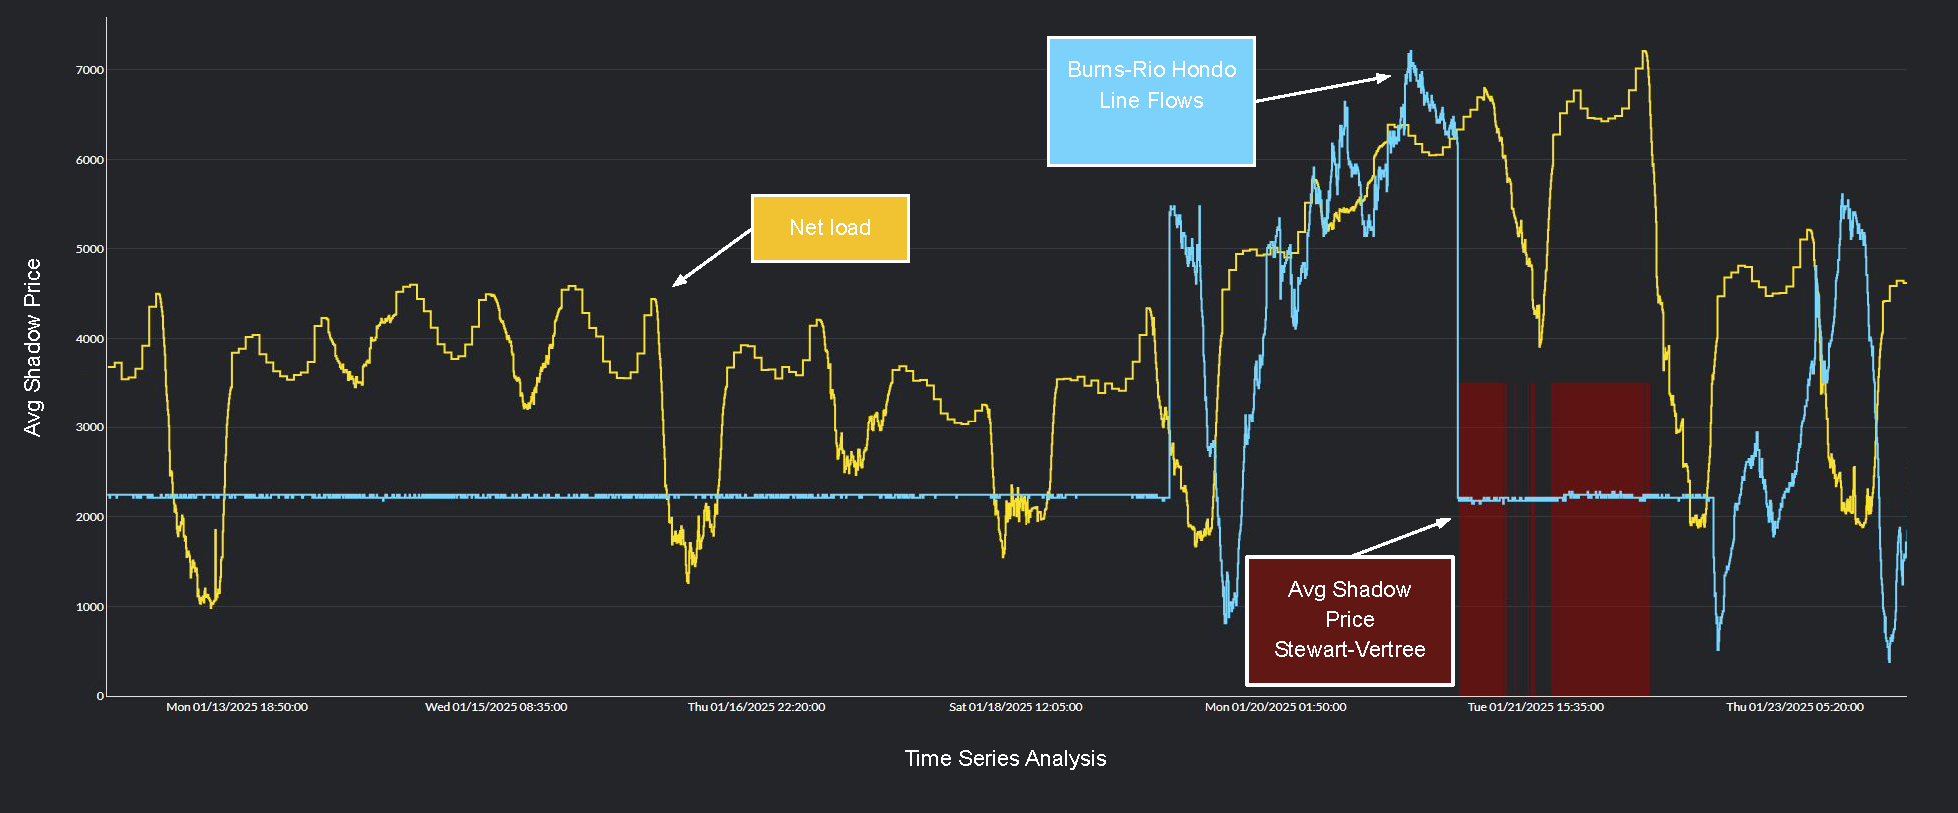
Stay Ahead with Real-Time Energy Market Monitoring and Alerting.
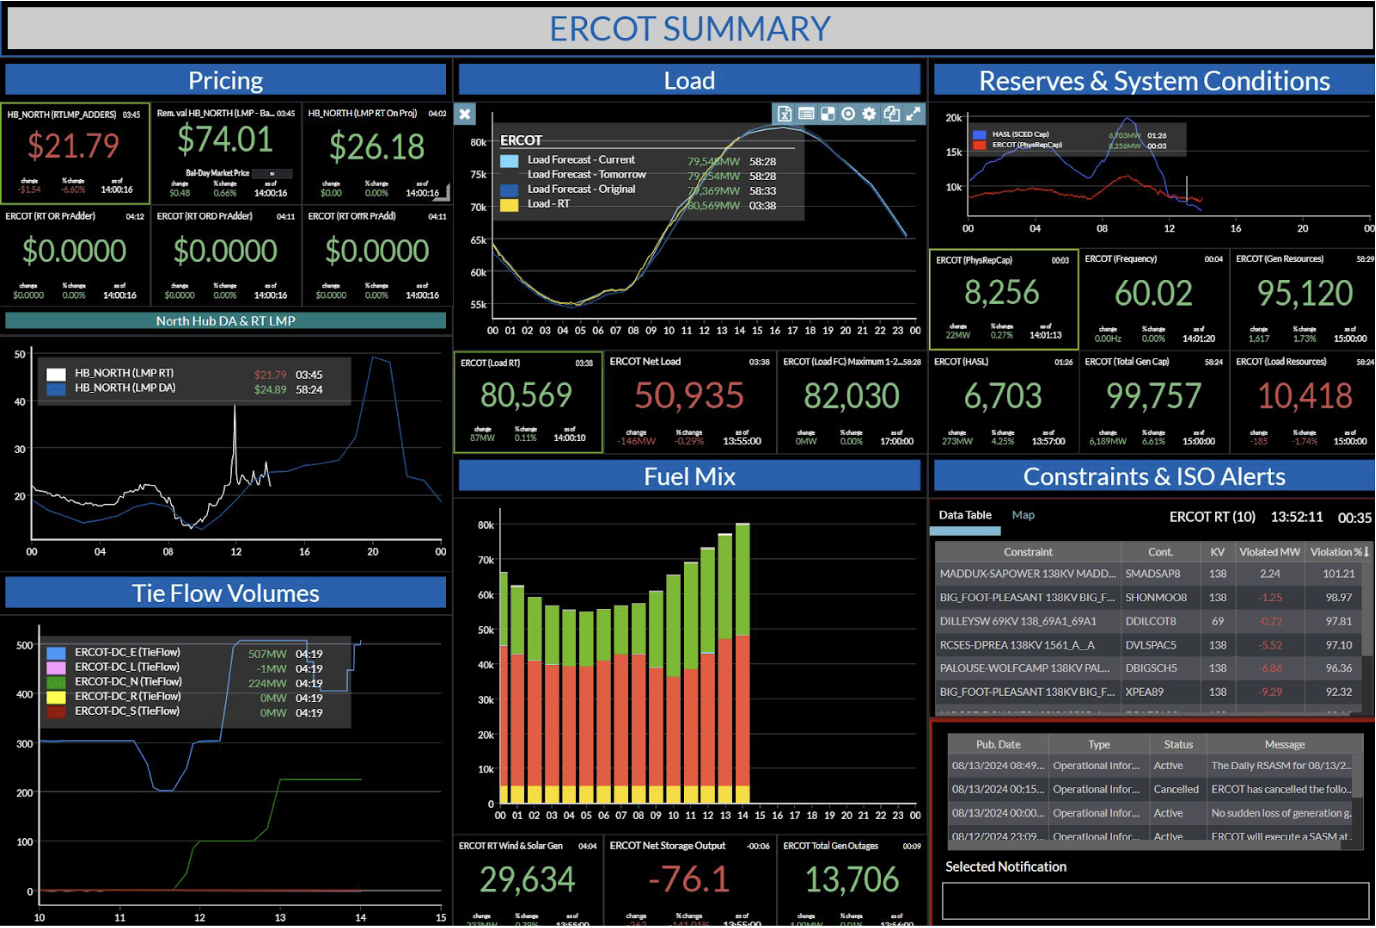
QuickSignals® translates energy market noise into timely, actionable, and customizable insight. QuickSignals’ low-latency data enables you to visualize changes in the market using easy-to-use dashboards and stay on top of opportunities as they materialize in real time.
Get live updates and alerts of all of the valuable ISO market data such as prices, constraints, live load curves, outages, weather, volatility indicators, and time-series graphs. QuickSignals is integrated with our PowerSignals® solution, making it easy to drill down from a single tick in your QuickSignals dashboard to the robust history and analytics available in PowerSignals.
KEY BENEFITS
- High-speed ISO market monitoring
- Unlimited dashboards to create and share
- Many customizable display and data options enable you to display the ISO market data most relevant to you
- Pre-built, drag-and-drop dashboard widgets make dashboard configuration easy
- Custom alerts to keep up with critical events
- QuickSignals Mobile keeps you alerted on the go
- Drilling from QuickSignals’ dynamic display to PowerSignals’ history and analytics
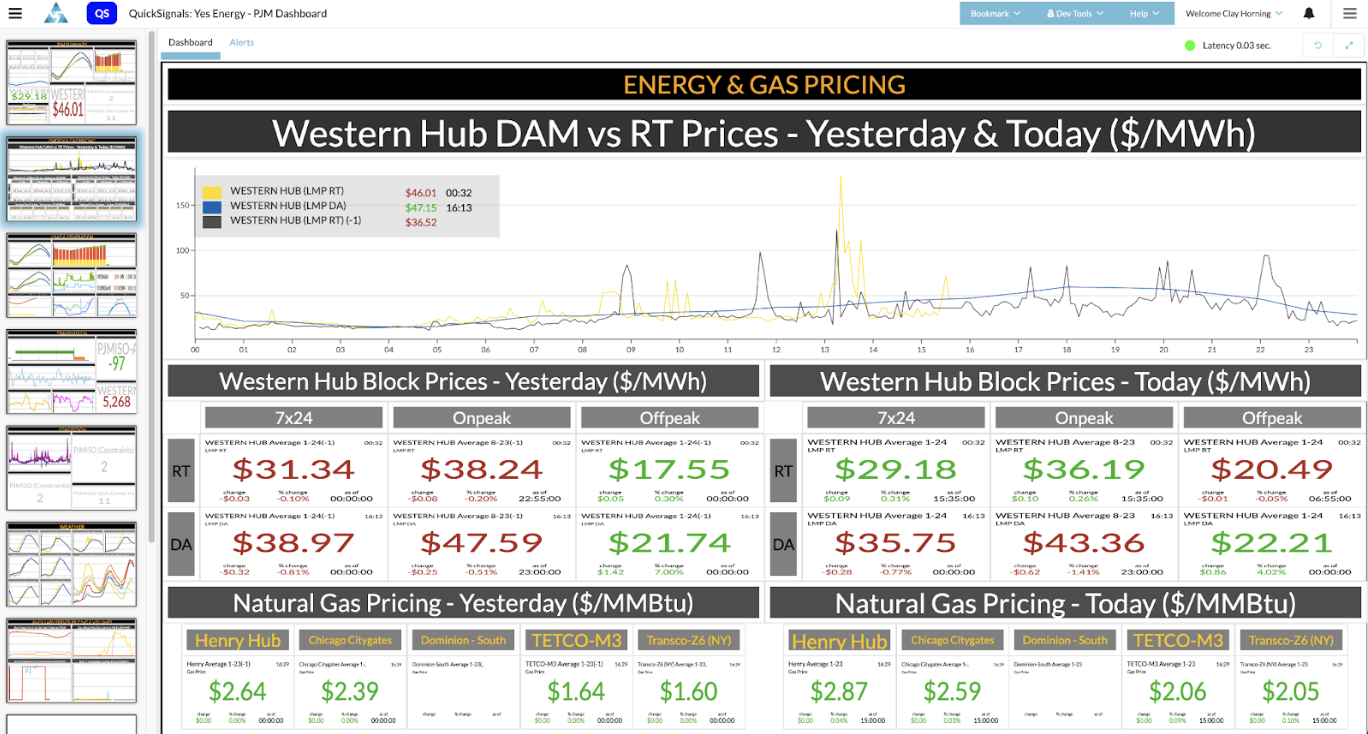
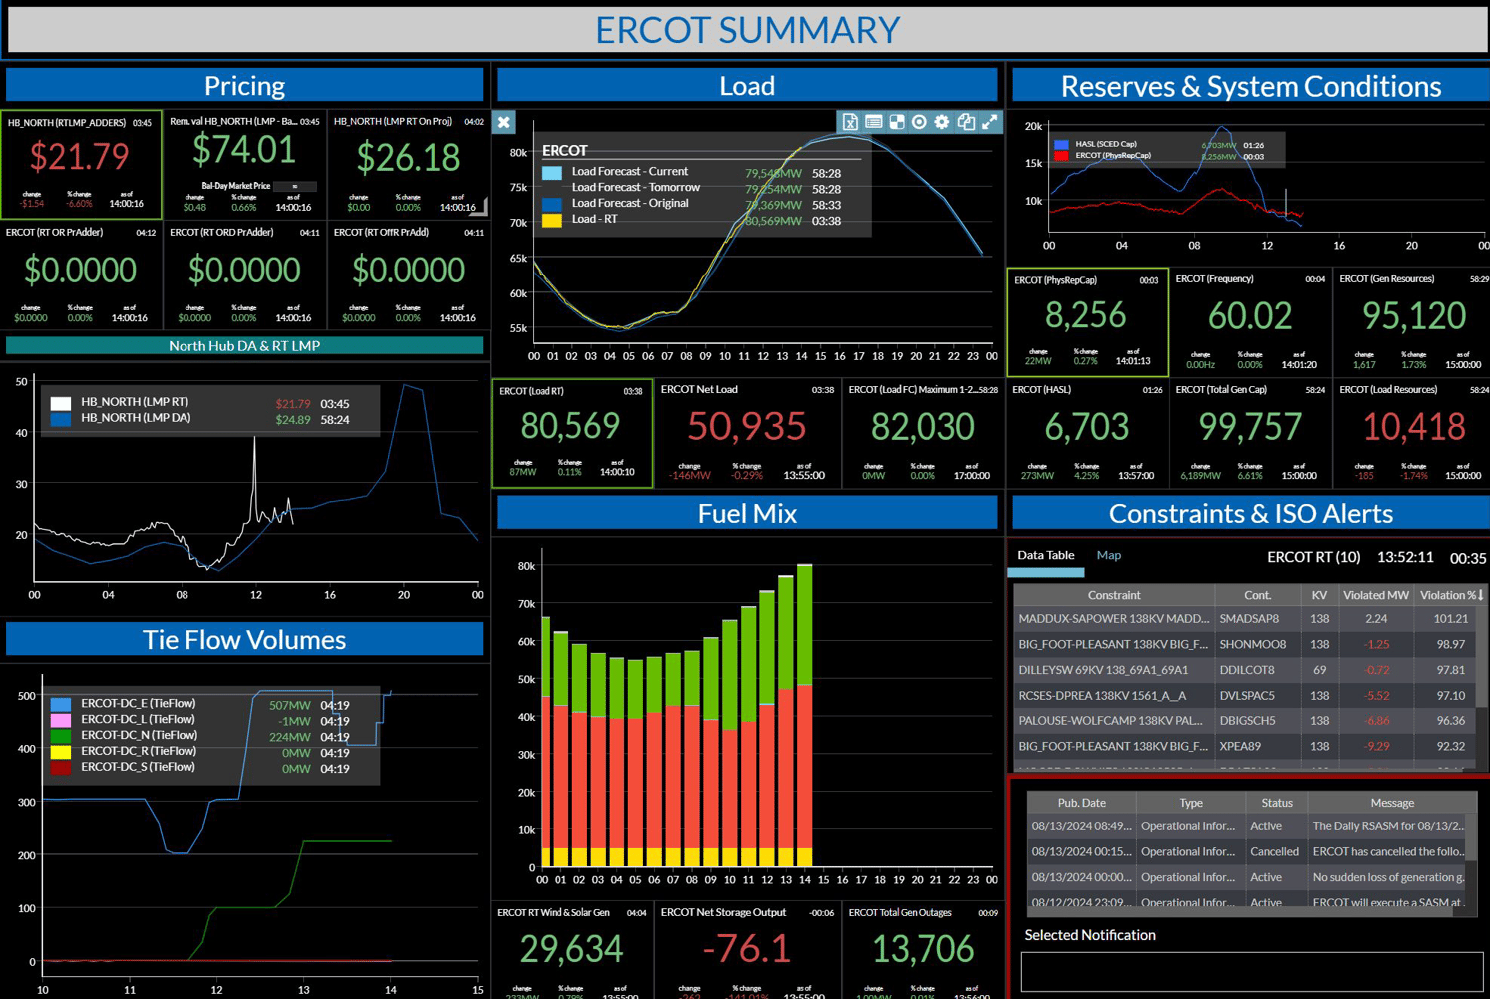
The Fastest Power Market Data
Live updates and alerts for prices, constraints, load curves, outages and more.
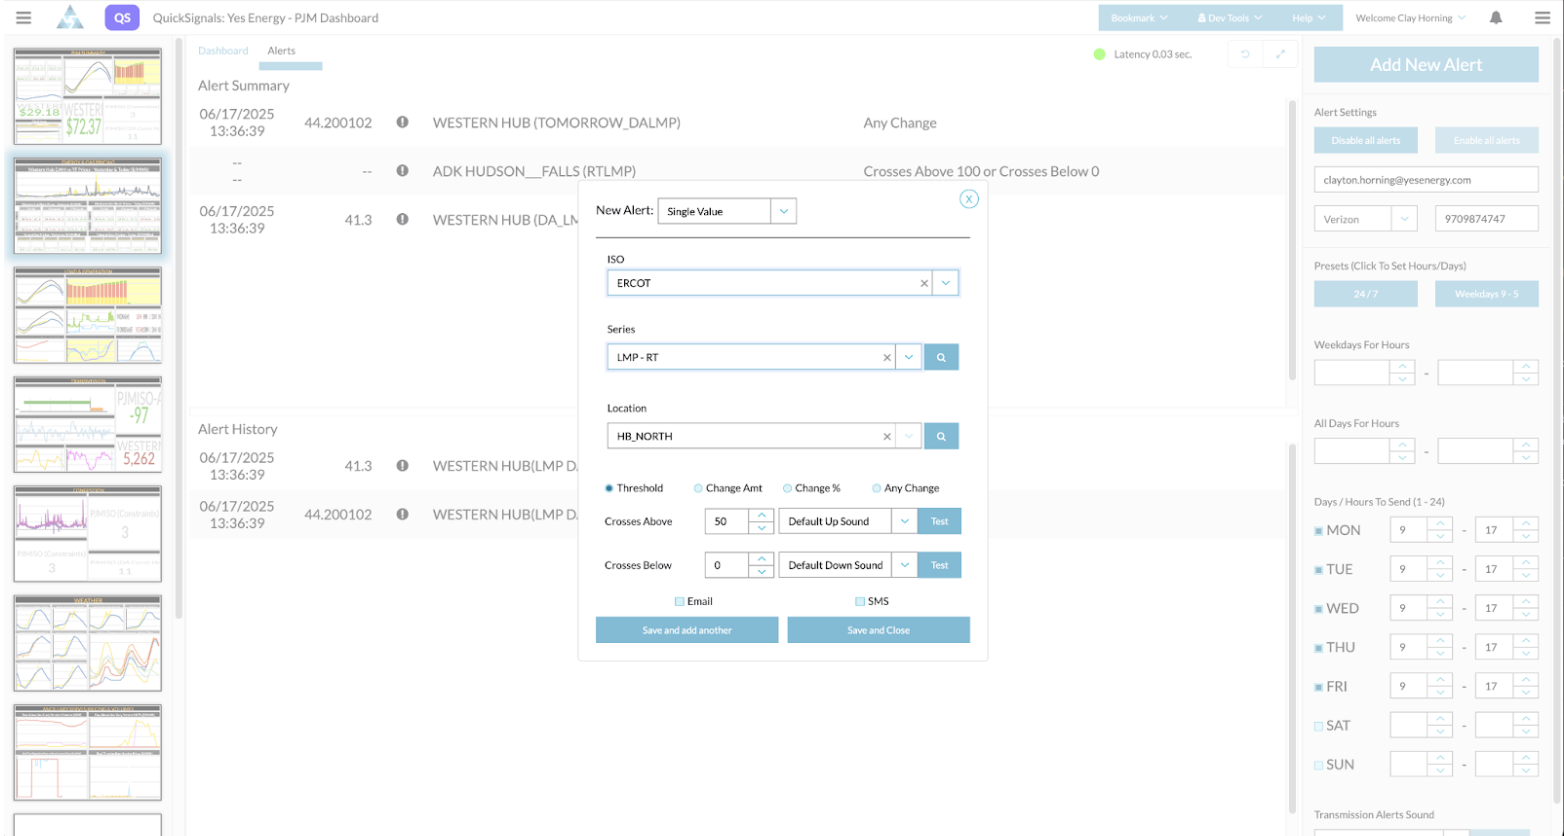
Built for Your Workflow
Customize alerts and your dashboard with 21 drag and drop widgets.
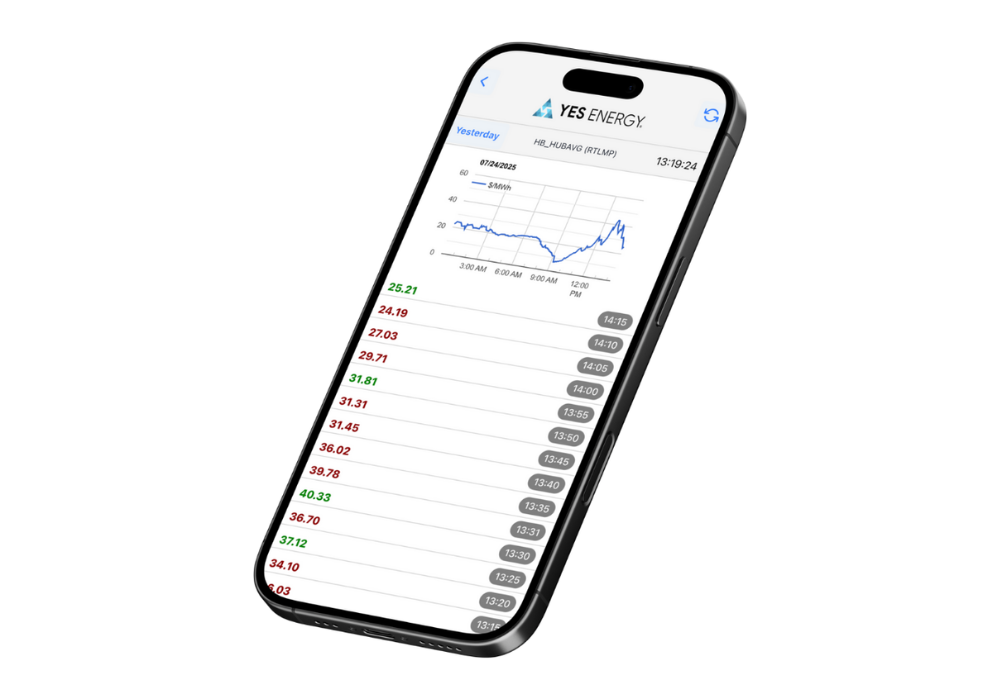
Stay Connected
Track market moves on the go with mobile optimized dashboards and live alerts.
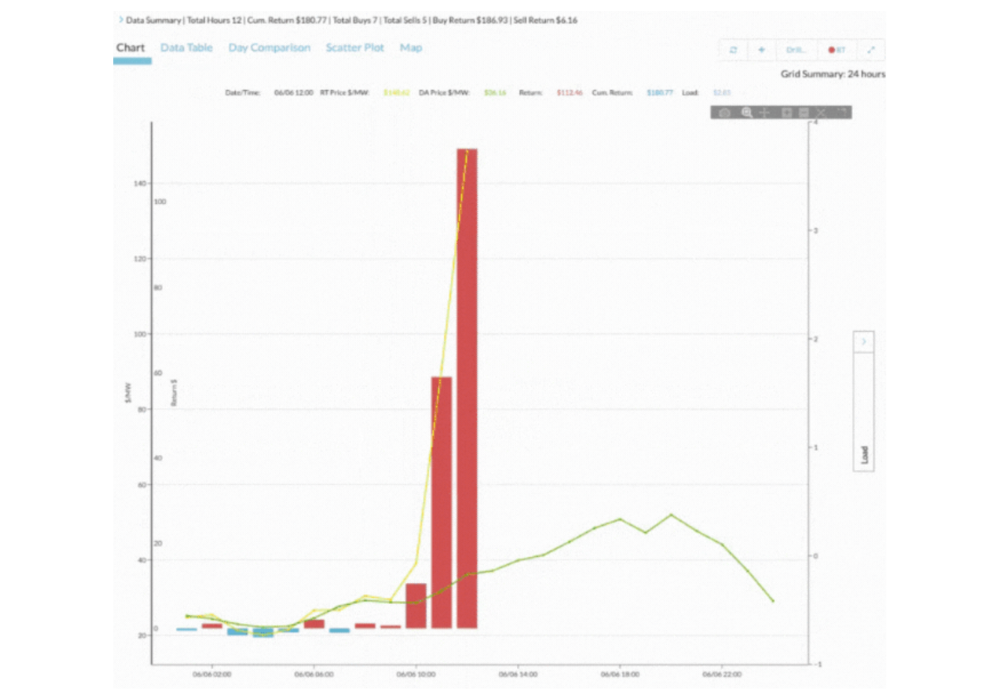
From Signal to Strategy
Integration with PowerSignals for historical context and deeper analysis.
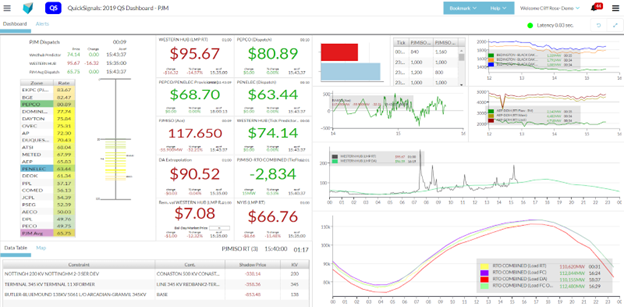
EASY-TO-CONFIGURE CUSTOM DASHBOARDING
Use easy drag-and-drop functionality to build one (or many) custom dashboards that monitor what’s important to you.
QuickSignals has pre-built widgets, including tickers for prices and constraints, live load curves, outages, weather, volatility indicators, and time series graphs. It also delivers the ability to calculate your own series of indicators and custom watchlists.
Monitor your special watchlist of locations or metrics via QuickSignals Mobile.
FAQ
Our dedicated Data Quality Team closely monitors our crawlers/collectors for quality issues (outlier detection, revisions, etc.). We handle price revisions better than any data provider in the space. We have a dedicated Power Infrastructure Team who keeps up with object name and location changes in real time (price nodes, power plants, transmission lines, etc.).
- QuickSignals is a real-time alert and energy market monitoring tool that delivers immediate insights into ISO conditions as they unfold. Use it to react quickly to price spikes, constraint shifts, and other movements, so you can seize trading opportunities the moment they appear.
- PowerSignals is a strategic analysis platform. It offers standardized live and historical market data, along with advanced visual analytics. Use it to help develop trading strategies, analyze trends, and monitor market drivers.
.png?width=1080&height=1420&name=DS%2c%20PS%2c%20QS%20Features%20Chart%20(1).png)

Emily Merchant
Director of Product
"Yes Energy's QuickSignals translates market noise into timely, actionable, and customizable insight. QuickSignals allows you to configure custom dashboards, highlighting data points you need to make trading and asset dispatch decisions, or just keep an eye on wholesale market movements. Stay on top of real-time energy market opportunities with low-latency data delivered straight to your dashboard."
MORE INSIGHTS
.png)
How to Evaluate Energy Trading Software Solutions: 12 Questions to Ask
.png)
Ontario’s Power Market Goes Nodal. How to Prepare.
