PowerSignals: Your Power Market Data Solution

Make Smarter Decisions with Actionable Power Market Data.
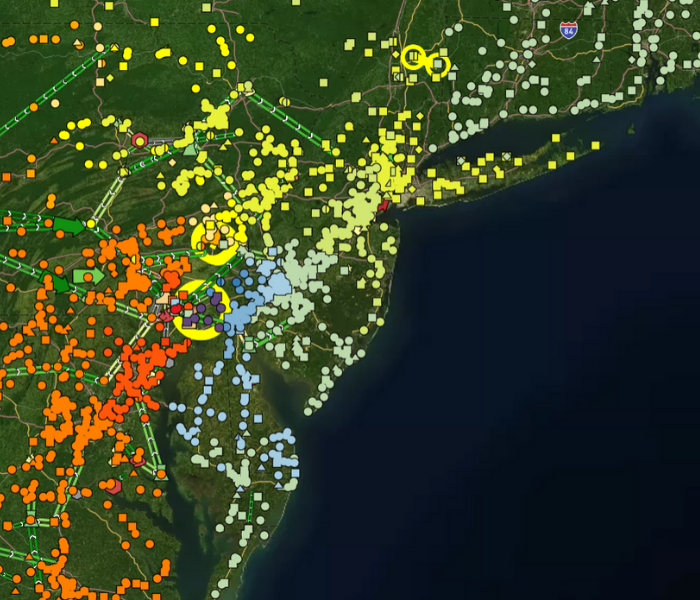
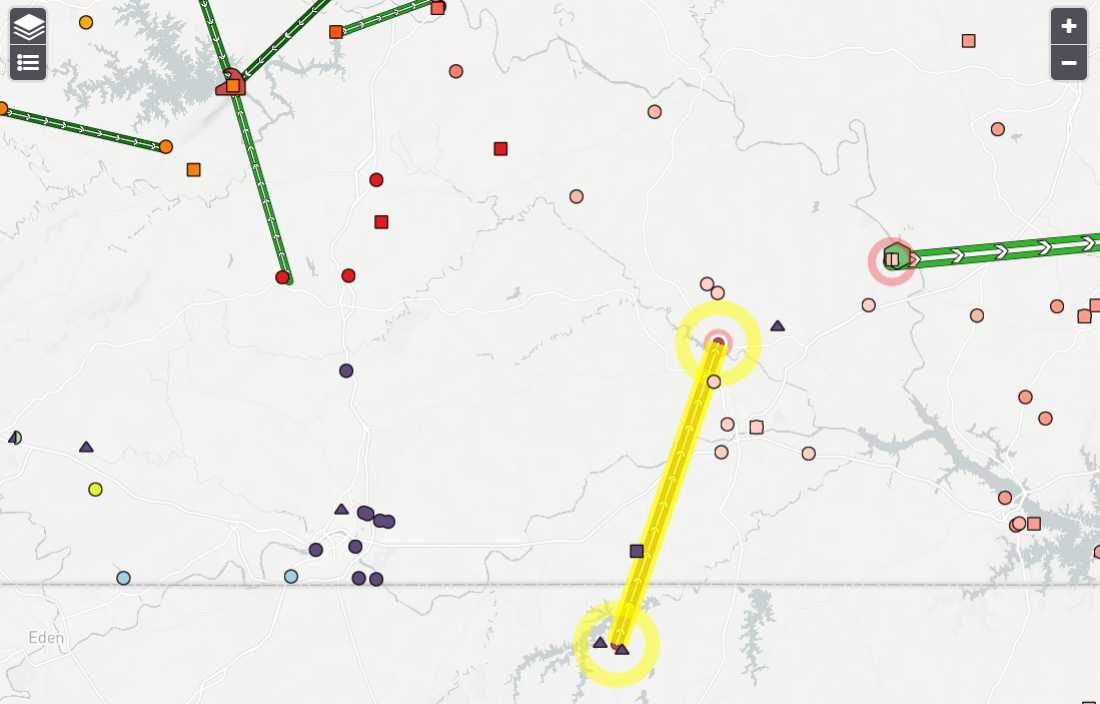
PowerSignals’ intuitive modules enable you to leverage high-quality information to understand market patterns and inform trading positions, hedging strategy, or dispatching decisions. Visualize ISO information such as nodes, nodal prices, transmission lines, generation and transmission outages, constraints, power plants, weather, and gas prices all on one map. For further analysis, PowerSignals allows you to easily drill down into more detailed maps, charts, and tables.
Plan smarter market moves with access to historical data that dates back to the market’s inception or view real-time data within minutes of when the ISO or other primary data source publishes it.
With Yes Energy’s experts behind PowerSignals, you never have to worry about information corrections or updates — PowerSignals will automatically pull in the latest.
KEY BENEFITS
- Real-time updates
- Extensive data history enabling historical analysis
- Standardizes information across ISOs and third-party data providers
- Dynamic platform continuously updated with the latest power market data
- Integrated view of market drivers
- Market screening tools
- Price, constraints, outages, weather, load — in the regions relevant to you
- Charts, graphs, and watchlists
- Live price maps, drill down to details
- Portfolio management tools
- FTR trading and tracking tools
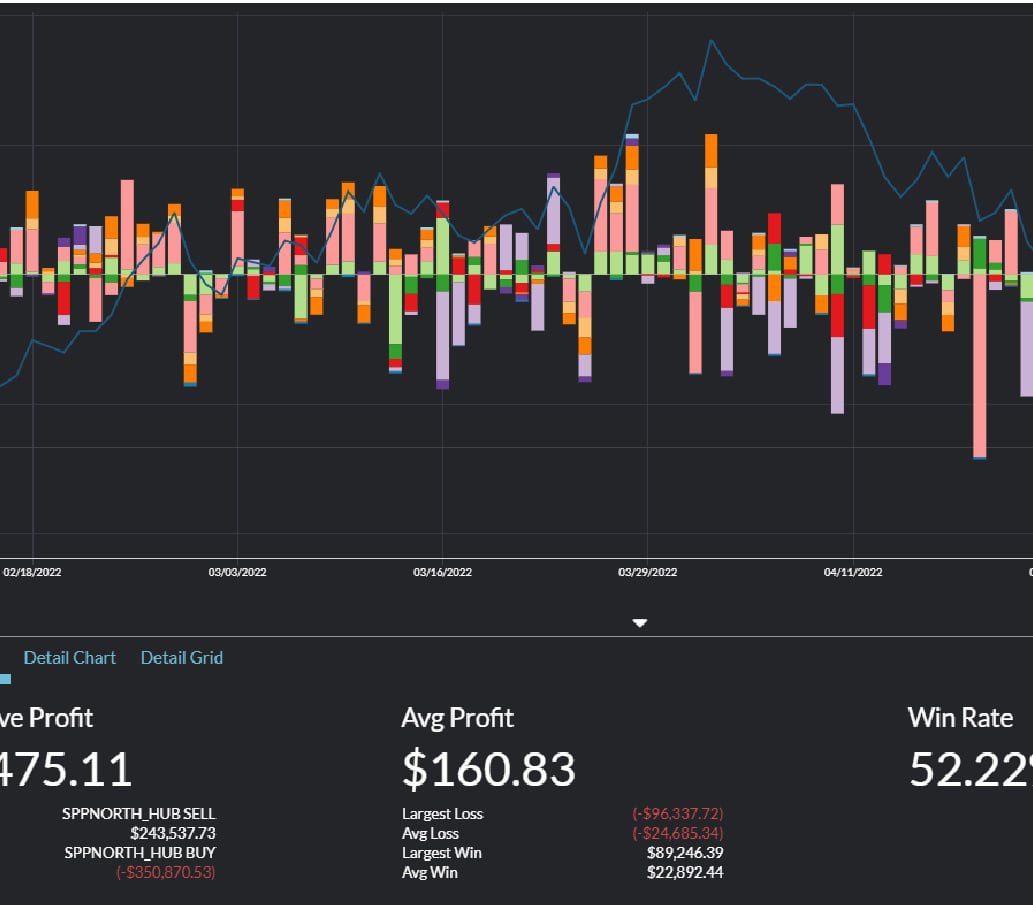
- Daily P&L performance reporting
- DART constraint analysis
- Alerting on relevant transmission and generation outages


ANALYTIC TOOLS
PowerSignals incorporates analytic tools designed to support power market analysis. Using maps, charts, tables, and drilldowns, comprehensive power market data is displayed in valuable mapping and visualizations that make datasets easier to understand.
The collective input of PowerSignals users informs these tools, keeping them closely aligned with common activities including market scans, price maps, time-series analysis, like-condition comparisons, performance distribution reports, nodal price analysis, constraint and outage profiles, and more.
FAQ
- Immerse yourself in comprehensive ISO data.
- View comprehensive maps that enable you to drill into market fundamentals.
- Develop trading strategies for bal-day, virtuals, spreads, and FTRs.
- Discover the best opportunities using visual analysis tools.
- Tune your portfolio using integrated market analysis.
- View alerting on relevant transmission and generation outages.
- With Yes Energy’s experts behind PowerSignals, you never have to worry about data corrections or updates – PowerSignals will automatically pull in the latest information.
- Our dedicated data quality and data operations teams closely monitor our crawlers/collectors for quality issues (outlier detection, revisions, etc.). We handle price revisions better than any information provider in the power market space. We have a dedicated Power Infrastructure Team who keeps up with object name and location changes in real time (price nodes, power plants, transmission lines, etc.).
- PowerSignals is your strategic analysis platform. It offers standardized live and historical power market data, along with advanced visual analytics. Use it to help develop trading strategies, analyze trends, and monitor market drivers.
- QuickSignals is a real-time alert and monitoring tool that delivers immediate insights into ISO conditions as they unfold. Use it to react quickly to price spikes, constraint shifts, and other movements, so you can instantly act on trading opportunities.
- PowerSignals is a visual analytics platform for exploring live and historical power market data.
- DataSignals delivers engineered, model-ready information across all nodes and markets – delivered through the technologies that best fit your workflow (API, Cloud, lake).
- Fastest-in-industry real-time information so your decisions are based on the most up-to-date, accurate view of the ISOs
- Advanced visualizations that make datasets easier to understand and explore, including maps, charts, tables, and more
- Comprehensive ISO market data so you have the most complete view of dynamics for informed decision-making (Yes Energy collects 750,000+ data files and 110,000,000+ rows of new data per day.)
- A team dedicated to proactively monitoring each ISO for new datasets or data changes that will impact you. If an ISO is changing report formats or website links or fails to report data, we’ve got you covered with our experts managing it. (Our team resolves 200,000+ ISO reporting issues each year.)
- Get fast answers and expert guidance from our responsive support team and your dedicated Customer Support Manager, ensuring you get the most from your tools and information.
.png?width=1080&height=1420&name=DS%2c%20PS%2c%20QS%20Features%20Chart%20(1).png)
MORE INSIGHTS

ERCOT RTC+B Market Redesign FAQ Part II
.png)
ERCOT RTC+B Market Redesign FAQ
.png)


