


If you work in energy markets, you've probably noticed that price spreads have been behaving differently lately — and it's not your imagination. Several structural forces are reshaping how energy spreads across regions and nodes, and understanding them is becoming more critical than ever.
This blog expands on Jack Farley's discussion of five fundamental trends in energy spreads from Yes Energy's 2026 user conference, EMPOWER.

Jack Farley, Chief Commercial Officer at Grid United, speaking at Yes Energy's EMPOWER 26.
The five factors driving spread expansion are: growth in loads, growth in renewable penetration, more frequent extreme weather events, higher natural gas prices, and a greater ratio of load-to-transmission capacity. Understanding each — and how they interact — requires both a historical perspective on how spreads have trended over time and a clear view of the fundamental forces driving their expansion. That's exactly what Yes Energy Market Data is built to support, whether you're trading, managing assets, or developing projects.

1. Growth in Loads
As load growth in every ISO is perpetuated by factors like data center development, crypto loads, heavier industrial demand, and more advanced manufacturing, there has been a general flattening of ISO-level and zonal load profiles.
Historically, power demand was spiky—large peaks on summer afternoons, deep valleys overnight, and in shoulder months. However, with demand from newer loads like data centers and industrial/heavy manufacturing increasing, the trend is becoming a more consistent, flatter load profile across the board, with a higher load factor.
 Jack Farley, Chief Commercial Officer at Grid United, speaking at Yes Energy's EMPOWER 26.
This has the consequence of increasing nodal price spreads from areas in which these higher loads are physically sited to areas of lower demand. Jack Farley, CCO of Grid United, explained this in an example from his presentation at EMPOWER, “If Colorado gets a big flattening of load but its neighbors in Wyoming and Montana don’t, you’ll actually have lower correlations and higher spreads.”
It is the disparity between the flatter, higher load profiles and the traditionally higher-peaked load profiles that causes the divergence in spread pricing. Farley further explained this concept, “… if you get flattening on both sides, fine, spreads are going down. If you get a mismatch for one side getting flatter, the other side staying peaky on loads, you’re going to get a widening of spreads.”
While peak/off-peak spreads may tighten under these newer load regimes, regional (basis) spreads show expansion, especially when comparing higher load growth areas to areas with traditionally lower load factors.
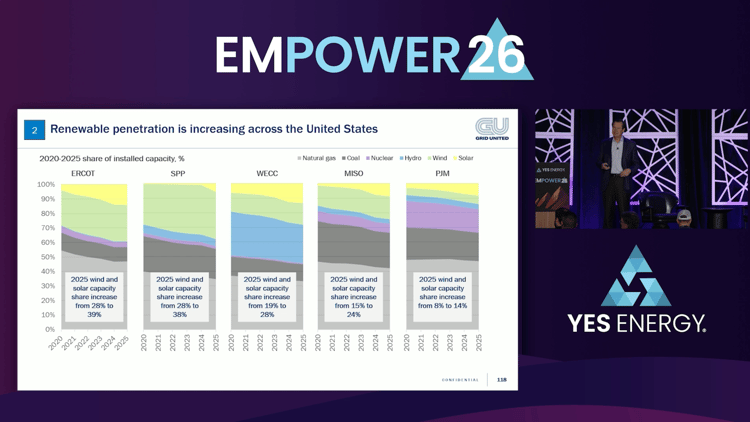
2. Growth in Renewable Penetration
It’s no secret that renewable penetration has substantially increased in recent years, and this is met with further price divergence on regional and localized levels. Congestion, simply stated, is a supply and demand imbalance, and when you add supply in one area or zone via renewable installment and not in others, times of high renewable output will yield greater nodal pricing spreads between the two areas.
Farley, in comparing SPP with PJM in terms of renewable penetration, first cited the renewable penetration of PJM being much lower than that of SPP and illustrated “… you can see where the SPP spreads are nearly double and sometimes more than double [than that of PJM].” It’s a natural conclusion that increased renewables in markets like SPP yield higher energy price spreads between that market’s hubs and zones, simply due to supply and demand imbalances occurring when a mismatch exists between demand and supply sources in a renewables-dominated market.
Jack Farley, Chief Commercial Officer at Grid United, speaking at Yes Energy's EMPOWER 26.
Farley cited increased renewable penetration as “… a general secular bullish trend for energy spreads.” And further explained that “The intermittency of the supply, where the supply concentrates on the particular regional grid, it is a big congestion maker…”
This can be confirmed when observing regional price spreads over time, as congestion has generally increased alongside renewable additions, a trend that shows no signs of slowing. For congestion traders, asset managers, and developers, the takeaway is straightforward: understanding where renewable development is heaviest, and how spreads are widening as a result, is increasingly central to decision-making.
3. Higher Natural Gas Prices
Natural gas prices experience shocks due to factors like geopolitical events, regional supply imbalances, particularly in winter, and increased demand for cheap US gas overseas via liquefied natural gas (LNG). Higher natural gas prices increase energy price spreads across regions. This is not just due to the spreads in natural gas itself between regions, but across the board, as gas prices rise, congestion rises with them. This is because, as Farley explains, “… as gas goes up it pushes that marginal unit…”, meanwhile, on the opposing side of a constraint, the marginal unit may be “coal and wind or a more efficient gas unit, and you get a higher absolute spread and you can see gas plays a big role in all of these markets…”
Gas continues to play an increasingly important role in grid dynamics, as the intermittency of renewables and the retirement of many coal plants have led to a greater need for firm power to be produced by additional units.
Last year, Farley observed, across five markets, gas had a significant contribution, making up “… a third to almost half of the grid.” Because gas units are frequently marginal, they continually play a price-setting role, exacerbating congestion in the process, particularly when their cost is high. Because of this, Farley states that “They punch higher than their weight, so they might be a third to a half of the capacity, but they set price half or more of the time.”
When viewing the impact that marginal gas unit clearing has on pricing spreads, particularly in higher gas price environments, it becomes clearer that gas plays a huge role. Viewing spreads in several markets, Farley illustrates in his presentation that “You see [spreads] pop in 2022 when the gray line, which is Henry Hub, popped up to about $6 levels… Then they all got dragged down in ’23 and ’24, as gas kind of receded and it went through one of its normal little cycles that it goes through.”
![Viewing spreads in several markets, “You see [spreads] pop in 2022 when the gray line, which is Henry Hub, popped up to about $6 levels… Then they all got dragged down in ’23 and ’24, as gas kind of receded and it went through one of its normal little cycles that it goes through.”](https://www.yesenergy.com/hs-fs/hubfs/Blog/Farley%20Energy%20Trends%20EMPOWER%2026/Farley_EMPOWER26_NatGas_5Trends.png?width=750&height=421&name=Farley_EMPOWER26_NatGas_5Trends.png)
Jack Farley, Chief Commercial Officer at Grid United, speaking at Yes Energy's EMPOWER 26.
Even though increased gas prices at all major hubs have the consequence of raising energy spread prices, the issue can be localized as well. Farley’s opinion on the localized issue is that, “I would point out I think the story on gas with energy spreads is local.” Furthermore, areas like New England (Algonquin gas) experience a strong localized basis in the wintertime. While this may not push up price spreads across New England itself when congestion is lacking, it does greatly increase inter-ISO price spreads between NEPOOL and other nearby markets like NYISO and PJM. As Farley states, “I think here you can see some regional story that’s different than the more generalized Henry Hub story that we’re looking at here. Don’t fall asleep on gas on a regional basis.”
To understand forward-looking gas prices and their impact on power price spreads, it is important to understand the historical implications they have had on grid pricing through appropriate data-driven insights via platforms like Yes Energy.
4. More Frequent Extreme Weather Events
Winter storms like Elliot and Fern have led to an increase in energy price spreads in the affected regions. As Farley stated in his presentation, “… sometimes when you get extreme events, absolute prices all go up, and spreads actually collapse, right, because they’re all at the top.”
 Jack Farley, Chief Commercial Officer at Grid United, speaking at Yes Energy's EMPOWER 26.
But this is often more of an exception than the rule, as pockets of higher demand exist and continue to grow, particularly in areas like the infamous data center pocket of Northern Virginia. Farley states, further to this point, that spread collapse is “… not typical if you look at a lot of these events, typically there is a bigger impact on some certain pockets of the grid than other pockets of the grid, so they don’t all go up.”
As far as the increase of extreme weather events, Farley noted that “… the counts have been going up. In the last five years, looking back, we had about 24 big events per year, mainly around storms.” Thus, the future outlook of extreme events is that they will occur at greater frequency, making price divergence between regions an increasingly important factor to monitor.
The relevance is apparent in the trading of financial transmission rights (FTRs) and virtual products, as well as the siting and managing of assets. A clearer view into how price spreads will trend over time and the weather’s impact on this is increasingly vital to all market participants, regardless of role.
Click here to see how PowerSignals can help.
5. Greater Ratio of Load-to-Transmission Capacity
Transmission capacity as it relates to load has a clear impact on how congestion is priced in Day-Ahead (DA) and Real-Time (RT) markets. Higher load-to-transmission ratios increase congestion costs, thus widening nodal price spreads. As loads continue to increase, it becomes clearer that transmission struggles to keep up, as evidenced by increased congestion over the last several years. Transmission infrastructure is generally expensive and time-intensive to upgrade, while loads may be able to interconnect much faster, depending on location and interconnection queue wait times.
Farley, in his presentation at EMPOWER, explained the difference between transmission capacity vs. load in CO and MT. He stated, “In Colorado, peak load is about 12.5 GW, but Colorado has only got a little less than 2 GW of interconnectivity to its neighbor up North, which is a ratio of about seven-to-one peak load to import capacity… Whereas Montana up there has almost a one-to-one ratio of peak load to import capability… That’s where you’re going to get spreads collapsing and being fairly neutral across, right?”
Reasonably, areas with higher transmission connectivity to adjacent power sources via imports relative to their load will see lower spreads compared to regions of the inverse scenario. Strong imports relative to load can serve to keep prices depressed, whereas grid tightness is more of an issue during generation shortages when the load-to-import ratio is much higher.
When comparing regional spreads to CO and MT, Farley noted that, not surprisingly, “… Mid C to Montana, much lower spreads, you know, low single digits lately, and spreads to Colorado, staying up near kind of low double-digits, because of that ratio of transmission to peak load.”
 Jack Farley, Chief Commercial Officer at Grid United, speaking at Yes Energy's EMPOWER 26.
You can think similarly about ERCOT, which has very little import capacity, relative to peak load, compared to SPP, with a much lower ratio of import capability to peak load. The spread between the two, particularly in higher load times of the year, can be quite wide, with ERCOT remaining premium to SPP. This is why Farley referred to load-to-transmission capacity as the “big daddy of factors” when it comes to price spreads, particularly across large regions.
Conclusion
It is clear that several factors impact regional and sub-regional energy price spreads, from load growth and renewable penetration to natural gas pricing, more frequent weather extremes, and load-to-transmission ratios. Staying informed on each of these factors requires greater diligence than ever before, and sharper tools.
To stay on top of how these price spread drivers can impact your portfolio, whether trading, managing assets, or developing them, request a demo of Yes Energy products to get historic power market data and better inform decisions.
While the past doesn’t foretell the future, having historical reference for how each factor can impact price divergence across ISOs has never been more critical.

Meet the Author
