


The financial transmission rights (FTRs) market continues to have a highly concentrated profitability landscape, with PJM and MISO accounting for more than 91% of total FTR profits over the study period from June 2025 to May 2026. The following analysis was prepared using Yes Energy's FTR Positions Dataset, which provides complete visibility into FTR positions and results across all seven US ISOs.
Key Findings
-
Total reported FTR profit exceeded $4.27 billion.
-
PJM generated approximately 70% of all observed profits.
-
MISO contributed another 21%.
-
Profitability accelerated significantly during the winter months, particularly in January 2026.
-
Market performance was heavily concentrated among a small number of participants, with several traders and utilities capturing outsized returns.
-
ERCOT showed positive aggregate profitability but significantly lower average profit per position than PJM and MISO.
Quick Links
→ Deeper Analysis of the Top FTR Participants
→ Strategic Takeaways for FTR Participants
Market-Wide Performance
Total Profit by ISO
| ISO | Total Profit ($) | Share of Total |
| PJM | ~$3B | 70.3% |
| MISO | ~$898M | 21.0% |
| NYISO | ~$114M | 2.7% |
| ERCOT | ~$110M | 2.6% |
| CAISO | ~$96M | 2.2% |
| ISO-NE | ~$47M | 1.1% |
| SPP | ~$5M | 0.1% |
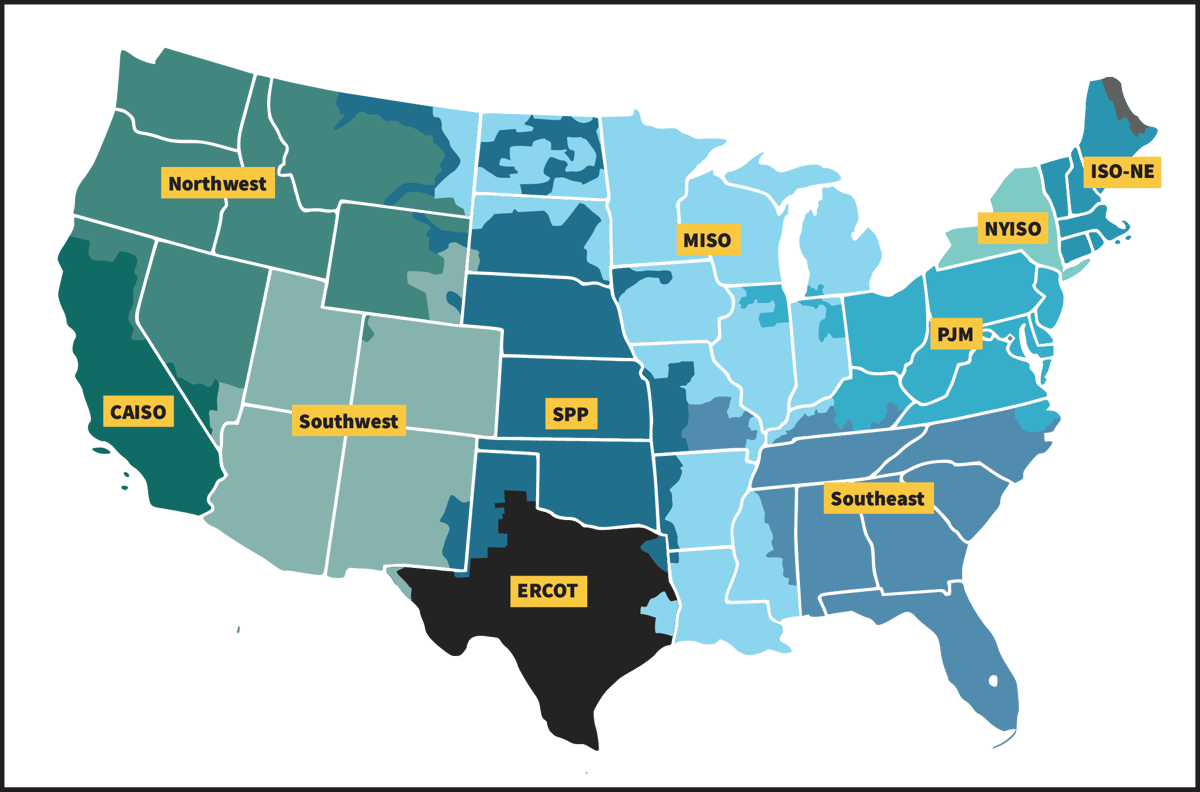
Source: FERC.gov
Key Insight
The results reinforce a trend that many market participants have observed for several years.
PJM and MISO continue to provide the deepest congestion opportunities and the largest FTR monetization potential.
Both markets exhibited substantially higher aggregate profits than ERCOT, CAISO, NYISO, ISO-NE, and SPP combined.
Seasonal Trends
Monthly Profitability
The dataset reveals strong seasonality.
| Highest Profit Months | |
| Month | Total |
| January 2026 | ~$1.21B |
| February 2026 | ~$468M |
| July 2025 | ~$390M |
| May 2026 | ~$370M |
| October 2025 | ~$349M |
| Weakest Month | |
| Month | Total |
| August 2025 | ~$2.9M |
Key Insight
January 2026 produced nearly three times the profitability of most other months.
Key drivers include:
-
Extreme winter weather
-
Elevated congestion volatility
-
Generator outages
-
Significant basis separation across constrained regions
This suggests that weather-driven congestion remains one of the strongest contributors to FTR value creation.
Top-Performing Participants
| Highest Aggregate Profits | |
| Participant | Profit |
| DC Energy | ~$553M |
| Dominion Energy (LSE) | ~$437M |
| Exelon | ~$347M |
| Appian Way Energy | ~$200M |
| Peakstone Energies | ~$176M |
| FirstEnergy | ~$173M |
| Saracen | ~$149M |
| Elliott Bay | ~$138M |
| Appalachian Power | ~$128M |
| Hamilton Liberty | ~$103M |
Observations
Several themes emerge:
1. Traditional utilities remain major FTR holders.
2. Specialized congestion traders continue to dominate.
3. Market expertise and sophisticated congestion forecasting remain key differentiators.
Deeper Analysis of the Top FTR Performers
A closer look at the leading participants reveals that the market is not dominated by a single trading strategy. Instead, there appear to be three distinct groups.
1. Utility/LSE hedgers (Dominion Energy, Exelon, FirstEnergy, Appalachian Power)
2. Specialized congestion traders (DC Energy, Appian Way Energy Partners, Saracen, Elliott Bay, Hamilton Liberty)
3. Hybrid participants combining proprietary trading and physical market exposure
1. DC Energy, the Most Diversified Winner
DC Energy generated approximately $553M in profit.
| Profit Distribution by Market | |
| ISO | Profit |
| MISO | $225M |
| PJM | $137M |
| ERCOT | $73M |
| SPP | $65M |
| CAISO | $28M |
| NYISO | $17M |
| ISO-NE | $8M |
Key Insight
Unlike most top performers, DC Energy earned profits across every major ISO.
This suggests:
-
A highly scalable congestion forecasting strategy
-
Extensive transmission modeling capability
-
Strong risk diversification
-
Ability to monetize both long-term and short-term congestion events
Seasonal Trend
DC Energy’s strongest month was January 2026, when it generated more than $93M, but profits remained positive throughout the entire study period.
This consistency is uncommon and indicative of a congestion trading team with many years of experience.
2. Dominion Energy, the Pure PJM Story
Dominion Energy generated approximately $437M, entirely within PJM.
What Stands Out
Unlike DC Energy, Dominion's profitability appears highly concentrated.
The participant captured:
-
$170M in May 2026
-
$115M in July 2025
-
$69M in October 2025
Interpretation
This profile is more consistent with:
-
Large hedge portfolios
-
Transmission rights tied to generation and load obligations
-
Structural congestion exposure rather than purely speculative congestion trading
Dominion's performance demonstrates how valuable FTRs can be when aligned with physical generation and load positions.
3. Exelon, the Winter Congestion Specialist
Exelon generated approximately $347M.
Key Observation
Nearly 60% of Exelon's annual profits occurred during:
-
January 2026 ($131M)
-
February 2026 ($39M)
-
March 2026 ($36M)
Interpretation
This concentration suggests exposure to major winter congestion events.
-
Potential drivers include:
-
PJM generator outages
-
Fuel switching dynamics
-
Winter peak load patterns
-
Regional transmission constraints
Exelon appears to have benefited substantially from weather-related congestion.
4. Appian Way Energy Partners, Financial Trading Focus
Appian Way Energy Partners generated approximately $200M.
| Market Breakdown | |
| ISO | Profit |
| PJM | $155M |
| NYISO | $28M |
| MISO | $16M |
What Makes This Interesting
Unlike the utility participants, Appian Way's profits were spread across multiple eastern markets.
This profile is consistent with:
-
Relative-value opportunities
-
Cross-market transmission analytics
The company appears less dependent on a single transmission system than many competitors.
5. Peakstone Energies, Consistency Over Volatility
Peakstone Energies generated approximately $176M.
Notable Characteristics
-
Peakstone had remarkably few losing months.
-
Even its weakest months remained profitable.
Implication
This suggests:
-
Tight risk controls
-
Portfolio diversification
-
Reduced dependence on extreme congestion events
Many participants earned large profits during congestion spikes. Peakstone appears to have generated returns more consistently throughout the year.
Capital Efficiency Leaders (Profit per MW)
Another interesting way to evaluate FTR performance is not by absolute profit, but by capital efficiency.
1. Profit per MW of contract exposure (how much profit was generated for each MW of FTR held)
2. Profit relative to acquisition cost (a proxy for return on invested capital)
Using this dataset, several participants stand out very differently from how they do when ranked solely by total profit.
| Participant | Total Profit | Profit per MW |
| Hamilton Liberty | $103M | $433/MW |
| FirstEnergy | $173M | $224/MW |
| Dominion Energy (LSE) | $437M | $108/MW |
| PPL Energy Plus | $92M | $61/MW |
| Appalachian Power | $128M | $36/MW |
| Appian Way Energy Partners | $200M | $12/MW |
| Elliott Bay | $138M | $10/MW |
| Exelon | $347M | $10/MW |
| Fuelwinds Energy | $103M | $8/MW |
| Duke Energy | $89M | $7/MW |
Key Observation
The most efficient participants are not necessarily the largest traders.
For example:
-
DC Energy generated the highest total profit ($553M), but only about $2.61 per MW of contract exposure.
-
Hamilton Liberty generated less total profit, but extracted more than 160 times as much profit per MW.
This suggests Hamilton Liberty and similar participants may be focusing on:
-
Highly targeted congestion positions
-
Concentrated high-conviction trades
- Selective auction participation rather than broad portfolio diversification
Return on Cost (Profit ÷ Cost)
Another useful metric is the profit generated relative to the cost of acquiring the FTRs.
Among the larger profitable participants:
| Participant | Approx. Profit / Cost |
| DC Energy | 4.18x |
| FirstEnergy | 4.15x |
| Fuelwinds Energy | 3.94x |
| Saracen | 1.99x |
| Appian Way Energy Partners | 1.60x |
| Duke Energy | 1.34x |
| Solios Power | 1.08x |
| Hamilton Liberty | 1.02x |
| Appalachian Power | 0.91x |
| Dominion Energy (LSE) | 0.91x |
Key Observation
This tells a very different story from profit per MW.
Most Efficient Capital Deployment
The leaders are:
-
DC Energy
-
FirstEnergy
-
Fuelwinds Energy
These firms generated roughly $4 of profit for every $1 spent on FTR positions.
This is generally indicative of:
-
Strong congestion forecasting
-
Effective risk-adjusted bidding
-
Consistent secondary market optimization
Two Distinct Winning Strategies
The data suggests two different paths to success.
Strategy 1: High-Volume Portfolio Optimization
Examples
-
DC Energy
-
Saracen
-
Fuelwinds
Characteristics
-
Large MW exposure
-
Multi-market participation
-
Lower profit per MW
-
Extremely strong return on capital
Goal: Generate steady returns through scale and diversification.
Strategy 2: High-Conviction Congestion Ownership
Examples
-
Dominion Energy
-
FirstEnergy
-
Hamilton Liberty
-
Appalachian Power
Characteristics
-
Very high profit per MW
-
More concentrated exposure
-
Fewer but more impactful positions
Goal: Capture structural congestion where participants have unique knowledge or physical market insight.
The highest-performing firms are not necessarily those with the largest FTR books — they are often those that:
-
Identify the right constraints.
-
Focus on the highest-value paths.
-
Deploy capital selectively.
-
Avoid tying up capital in low-conviction positions.
Yes Energy tools such as congestion analytics, outage intelligence, shift-factor analysis, and short-term transmission modeling can help participants move from a "more MWs" strategy to a "better MWs" strategy, improving:
-
Profit per MW
-
Return on capital
-
Auction bid efficiency
-
Portfolio concentration on the most attractive congestion opportunities
Utility Participants vs. Proprietary Traders
One of the most interesting findings is the difference in return profiles between utility participants and proprietary traders.
Utility Participants
Examples
-
Dominion Energy
-
Exelon
-
FirstEnergy
-
Appalachian Power
Characteristics
-
Larger individual profit spikes
-
Heavy PJM concentration
-
Strong winter event exposure
-
Likely tied to physical hedging needs
Proprietary Traders
Examples
-
DC Energy
-
Appian Way Energy Partners
-
Saracen
-
Elliott Bay
-
Hamilton Liberty
Characteristics
-
More geographically diversified
-
More consistent monthly profitability
-
Greater participation across multiple ISOs
- Less reliance on a single congestion event
The January 2026 Effect
A common thread among nearly all top performers was January 2026.
| Participant | January 2026 Profit |
| Exelon | $131M |
| FirstEnergy | $106M |
| DC Energy | $93M |
| Appalachian Power | $102M |
| Appian Way Energy Partners | $51M |
| Peakstone Energies | $47M |
| Elliott Bay | $33M |
Why This Matters
When nearly every successful participant experiences a major profit spike during the same month, it typically indicates:
-
A system-wide congestion event
-
Extreme weather conditions
-
Significant transmission outages
-
Broad market dislocations
This suggests that a large share of annual FTR profitability was driven by a relatively small number of high-impact congestion events.
Strategic Takeaway
The top performers demonstrate two successful approaches to FTR markets.
1. Scale and Diversification
Represented by DC Energy and Saracen.
Success factors:
-
Multi-ISO coverage
-
Broad congestion forecasting
-
Large position portfolios
2. Structural Congestion Ownership
Represented by Dominion Energy, Exelon, FirstEnergy, and Appalachian Power.
Success factors:
-
Deep knowledge of local transmission systems
-
Physical asset alignment
-
Long-term congestion exposure
The data suggests that the most durable FTR profits come from either:
1. Owning structural congestion associated with generation/load portfolios, or
2. Building sophisticated multi-market congestion analytics that can identify opportunities across several ISOs simultaneously.
Underperformance
Key Insight
Losses were concentrated among both:
-
Physical market participants using FTRs as hedges.
-
Financial traders being exposed to forecast errors in congestion.
This highlights the continuing challenge of accurately predicting transmission congestion over monthly and annual horizons.
ERCOT-Specific Observations
Although ERCOT generated approximately $110M in total profits, this accounted for only 2.6% of the overall profitability across markets.
Potential explanations include:
-
Absence of a traditional capacity market
-
Different congestion management framework
-
More dynamic transmission expansion
-
Increasing competition among congestion revenue right (CRR) participants
The data suggest that while ERCOT remains attractive for congestion trading, profit opportunities appear materially smaller than those observed in PJM and MISO during the study period.
Strategic Takeaways for FTR Participants
1. Weather Remains the Primary Alpha Driver
The concentration of profits during winter months indicates that weather-linked congestion events continue to create the largest opportunities.
Participants who integrate load forecasting, renewable generation forecasting, and weather analytics appear best positioned to capture congestion value.
PowerSignals integrates weather data, load forecasts, and wind and solar production into a single environment, giving FTR participants the inputs to anticipate weather-driven congestion before it shows up in prices.
2. PJM and MISO Continue to Offer the Best Risk/Reward
Combined, these markets generated more than 90% of observed profits.
For organizations allocating analytical resources, PJM and MISO remain the highest-priority markets.
Yes Energy's PJM and MISO coverage – constraint histories, congestion data, and outage intelligence – is built around exactly the markets where the largest FTR opportunities continue to concentrate.
3. Congestion Expertise Is Highly Concentrated
The gap between top and bottom performers exceeds hundreds of millions of dollars.
This reinforces the importance of:
-
Transmission topology modeling
-
Outage forecasting
-
Generator commitment analysis
-
Short-term congestion forecasting
PowerSignals supports each of these workflows through constraint-level congestion analysis, shift-factor tooling, and visibility into the topology and outage conditions that drive binding constraints.
4. Portfolio Diversification Matters
Several participants experienced substantial losses despite broad market profitability.
Successful firms appear to combine long-term auction positions, monthly rebalancing, secondary market transactions, and congestion event trading to manage risk across varying market conditions.
The Yes Energy FTR Positions Dataset – the source of the participant-level analysis in this report – gives traders direct visibility into how the market's most successful firms are sizing and rotating positions across auctions and ISOs.
Conclusion
The 2025–2026 FTR market period was characterized by:
-
Strong overall profitability ($4.27B total profit)
-
Dominance of PJM and MISO congestion opportunities
-
Significant winter-driven congestion events
-
High concentration of returns among specialized trading organizations
The results suggest that the competitive edge in today's FTR markets increasingly comes from sophisticated congestion forecasting, weather analytics, and short-term transmission modeling capabilities rather than simple directional congestion bets.
If your goal is to improve FTR performance — especially the types of results seen from participants like DC Energy, Appian Way Energy Partners, and Exelon — it is less about "predicting congestion" directly and more about identifying, quantifying, and monitoring the drivers of congestion before they show up in prices.
Where FTR Performance Typically Breaks Down
Based on the FTR performance analysis, most gains and losses come from forecasting errors in:
-
Transmission outages: addressed through Yes Energy's planned, forced, and real-time outage intelligence.
-
Generation outages: captured through the same outage feeds, with alerting on material changes.
-
Renewable output: supported by wind and solar production forecasts integrated into PowerSignals.
-
Load patterns: informed by Yes Energy's load forecasts and historical load overlays.
-
Constraint binding frequency: visible through constraint-level congestion analysis in PowerSignals.
-
Shift factor impacts: quantified through Yes Energy's shift-factor tooling.
-
Transmission expansion and topology changes: tracked through transmission topology modeling.
The challenge is not finding data — it's connecting thousands of market variables into actionable congestion views fast enough to make portfolio decisions.
How Yes Energy Helps FTR Traders
1. Constraint-Level Congestion Analysis
One of the strongest capabilities is visibility into historical and real-time transmission constraints.
Using Yes Energy, traders can:
-
Identify frequently binding constraints.
-
Analyze historical congestion drivers.
-
Compare day-ahead versus real-time constraint behavior.
-
Quantify impacts on nodes and paths using shift-factor analysis.
-
Evaluate which constraints most affect specific FTR positions.
FTR Impact
Instead of buying a path because it has historically been profitable, traders can determine:
Which constraint actually creates the value, and whether that constraint is likely to recur.
This is often the difference between a structural congestion trade and a speculative congestion trade.
Explore the FTR Workflow in Yes Energy.
2. Outage Intelligence
Many of the largest profit months in Yes Energy’s dataset — including January 2026 — resulted from transmission and generation outages.
Yes Energy aggregates:
-
Planned outages
-
Forced outages
-
Historical outages
-
Real-time outage changes and allows users to create alerts around these events
FTR Impact
A trader can:
-
Identify congestion risks before monthly auctions.
-
Evaluate outage persistence.
-
Determine whether a profitable historical path depended on temporary conditions.
For short-term FTR modeling, outage awareness is often one of the largest sources of alpha.
3. Historical Congestion Pattern Discovery
The best-performing traders typically look for recurring congestion patterns.
PowerSignals provides:
-
Historical locational marginal price (LMP) data
-
Historical congestion data
-
Constraint histories
-
Weather and load overlays
-
Market maps and visualization tools
FTR Impact
This enables analysis such as:
-
Summer versus winter congestion regimes
-
Renewable-driven congestion
-
Peak-load constraints
-
Seasonal path profitability
For example, if your analysis shows January profitability dominates annual returns, you can investigate:
-
Which constraints bound during those periods
-
How frequently they occurred
-
Whether the underlying drivers still exist
4. Multi-ISO Opportunity Screening
A notable characteristic of DC Energy's performance was diversification across ISOs.
Yes Energy covers multiple North American markets and standardizes data across them.
FTR Impact
This allows traders to:
-
Compare congestion opportunities across PJM, MISO, ERCOT, NYISO, and others.
-
Allocate risk where expected returns are highest.
-
Avoid concentrating exposure in a single ISO.
-
Many mid-sized FTR shops struggle because they are overly focused on one market.
5. Renewable and Weather Analytics
Increasing renewable penetration has made congestion more weather-sensitive.
Yes Energy integrates:
-
Weather data
-
Wind production
-
Solar production
-
Load forecasts
-
Gas market information
FTR Impact
Traders can better model:
-
Wind-driven congestion in MISO and SPP
-
Solar-driven congestion in ERCOT and CAISO
-
Weather-driven load shifts
-
Seasonal transmission stress
This is especially important because renewable variability increasingly influences congestion outcomes and FTR valuation.
Where Advanced Users Gain the Most Value
For sophisticated FTR participants, the biggest opportunity is combining Yes Energy data with modeling.
A common workflow is:
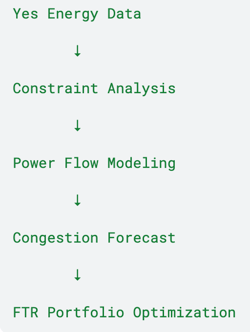
In this framework, Yes Energy becomes the data and intelligence layer feeding:
-
Power flow models
-
Auction valuation models
-
Monte Carlo congestion simulations
- Short-term FTR forecasting systems
Utility Winners
Examples
-
Dominion Energy
-
Exelon
These firms likely benefit from deep knowledge of local transmission systems and structural congestion.
Trading Winners
Examples
-
DC Energy
-
Appian Way Energy Partners
These firms appear to rely on systematic congestion analytics across multiple markets.
The areas where Yes Energy can most directly improve performance are:
1. Faster identification of emerging congestion opportunities
2. Better outage intelligence
3. Historical constraint analysis
4. Improved short-term congestion forecasting
5. More effective risk management and portfolio monitoring
The results suggest that the competitive edge in today's FTR markets increasingly comes from sophisticated congestion forecasting, weather analytics, and short-term transmission modeling capabilities rather than simple directional congestion bets.
Yes Energy supports many of the analytical workflows that distinguish the top performers in this report. PowerSignals provides the constraint, outage, weather, and renewable forecasting layer underlying short-term congestion analysis, and the FTR Positions Dataset offers the participant-level visibility used in this report. To see how either fits into an FTR program, request a demo.

Meet the Author