

On December 5, 2025, ERCOT implemented its long-awaited market overhaul. RTC+B, short for real-time co-optimization plus batteries, was a huge step towards modernizing ERCOT’s market engines. This change was backed by cost-saving projections, better utilization of resources based on capabilities, and reduced operator intervention. This blog will summarize the major changes from RTC+B and provide an analysis of key areas of the last six months of data.
To date, analysis of energy and ancillary services (AS) prices suggests that RTC+B is functioning as intended, with prices, volatility, and day-ahead to real-time (DART) spread magnitudes all telling a consistent story. A closer look at generation data revealed changes in resource mix composition and, overall, more optimal dispatch behavior. And lastly, reviewing the virtual AS data revealed increasing participation in this new market offering.
Summary of RTC+B Changes
RTC+B brought with it numerous changes to ERCOT’s day-ahead and real-time markets, and four major changes will be highlighted here:
1. ORDC Retirement
With the implementation of RTC+B, the Operating Reserve Demand Curves (ORDCs) were retired and replaced with Ancillary Service Demand Curves (ASDCs). ASDCs are used by the day-ahead market (DAM) and the real-time market, or security-constrained economic dispatch (SCED), to assign value to AS products and to prioritize certain AS types over others. For example, the curves are designed to exhaust non-spinning reserves first, followed by ERCOT contingency reserve service. This leaves specialized reserves, like regulation up, available for their prescribed use. Figure 1 shows an example of stylized ASDC curves. It's important to note that there is a unique ASDC for each AS product for each requirement amount. For example, the curve for the AS requirement of 2500 MW of non-spinning reserves differs from the curve for the requirement of 2000 MW. ERCOT posts DAM and SCED ASDCs daily, and more frequently as needed if the AS plan changes.
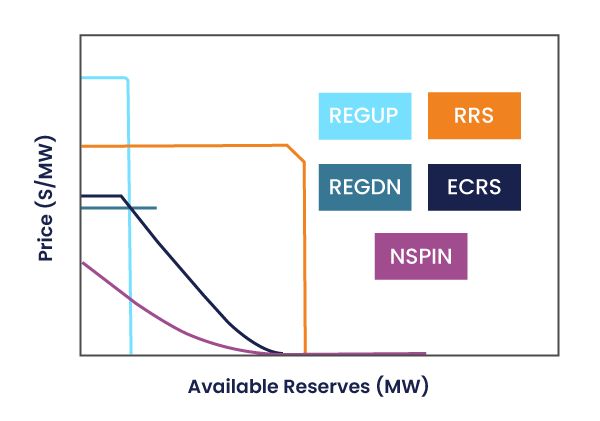 Figure 1: Stylized example of new ASDCs. Note: NSPIN=non-spin, ECRS=ERCOT contingency reserve service, REGDN=regulation down, REGUP= regulation up, and RRS=responsive reserve service.
2. Co-optimization of Energy and AS
Prior to the implementation of RTC+B, AS was awarded in DAM, and then SCED used the remaining capacity to dispatch energy. After implementing RTC+B, AS and energy are co-optimized in SCED. It's important to note that physical AS is still awarded in DAM, and virtual AS offers, or AS-only offers, have been added as well. The impacts of this RTC+B change include creating AS DART spreads and encouraging competitive offers for AS and energy in SCED. Additionally, qualified scheduling entities (QSEs) can trade in or out of positions as often as every 5 minutes. An illustration of co-optimization is shown in Figure 2.
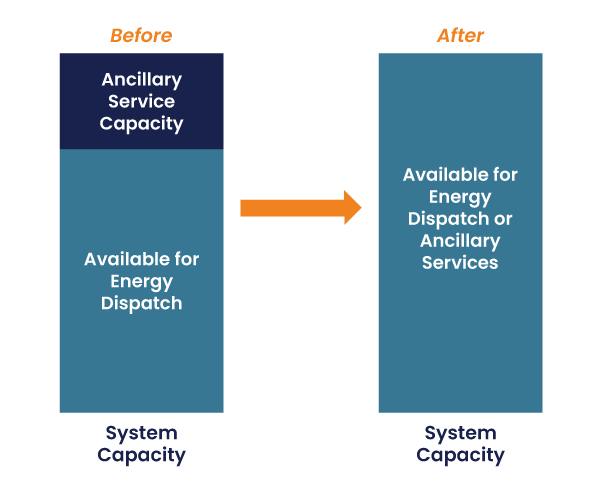 Figure 2: Illustration of co-optimization of energy and AS in SCED.
3. Single Model ESRs
Formerly, ERCOT modeled energy storage resources (ESRs), or batteries, as two separate resources. One resource was a controllable load that handled battery charging, while the other was a generator used when the battery was discharging. With the implementation of RTC+B, the two separate resources were consolidated from what was known as the combo model to the single model. The new model is a new type of resource that can have either a positive (discharging) or negative (charging) generation value. Figure 3 summarizes these changes.
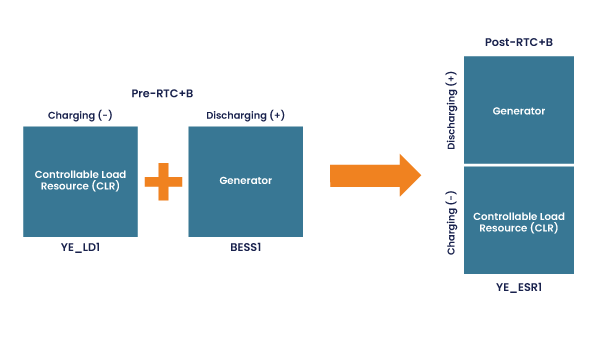 Figure 3: Summary of RTC+B ESR changes.
4. Changes to Charging Load
When RTC+B was implemented, ERCOT changed its definition of load to exclude charging demand. Instead, the charging load is now counted as negative generation. This aligns well with the new single model for ESRs; however, this creates some confusion when trying to equate load measurements from before and after RTC+B. While there are ways to use ERCOT data to approximate load with and without ESR charging, ERCOT load definitions are fundamentally different pre- and post-RTC+B.
Energy Price Analysis
This analysis compares equivalent pre- and post-RTC+B periods (December 2024–June 2025 vs. December 2025–June 2026). Data was sourced from ERCOT and includes DAM and SCED settlement point prices (SPPs). Winter Storm Fern data was excluded to avoid weather-driven price distortions. DART spreads were calculated as DAM SPP minus SCED SPP.
To date, energy prices post-RTC+B demonstrate that co-optimization is working. On average, energy prices and DART spreads are lower compared to pre-RTC+B, and prices are less volatile. Table 1 shows the average pre- and post-RTC+B SPPs for SCED and DAM for the hub average, with a clear reduction in SPPs. Figures 4 and 5 further illustrate the positive impacts on energy prices, showing the rolling 24-hour average SPPs for DAM and SCED.
| Pre-RTC+B ($/MW) | Post-RTC+B ($/MW) | Percent Change (%) | |
| SCED | 30.20 | 26.69 | -11.63 |
| DAM | 30.99 | 26.19 | -15.50 |
Table 1: Average SPPs for SCED and DAM over analysis periods for the ERCOT hub average, both pre- and post-RTC+B, with percent change.
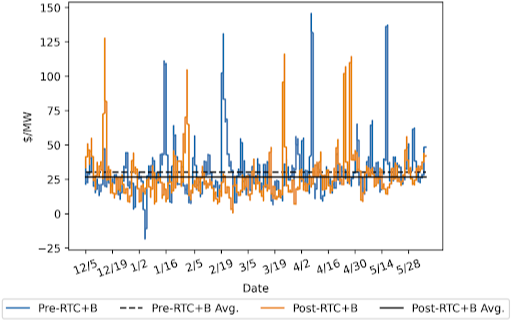 Figure 4: 24-hour rolling average SCED prices for ERCOT hub average. The overall average for the analysis periods is also included.
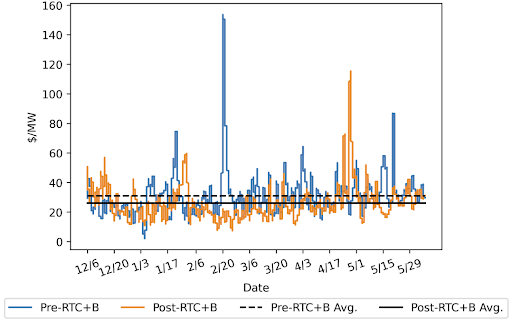 Figure 5: 24-hour rolling average DAM prices for ERCOT hub average. The overall average for the analysis periods is also included.
Figure 6 shows the average DART values for each ERCOT hub for the analysis periods, as well as the hub average. The hub average spreads were around 50% less post-RTC+B; however, the spreads switched from positive to negative overall. In fact, three of the five hubs did the same. This indicates that post-RTC+B, SCED is producing higher prices than DAM does on average, relative to pre-RTC+B values.
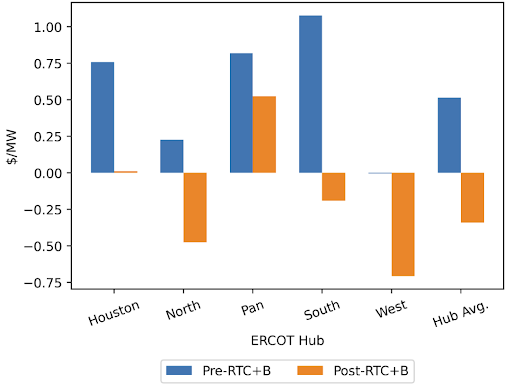 Figure 6: Average Energy DART spreads for ERCOT hubs for pre- and post-RTC+B.
Figure 7 shows average weekly DART spreads. DART spread fluctuations were greater pre-RTC+B compared to post-RTC+B.
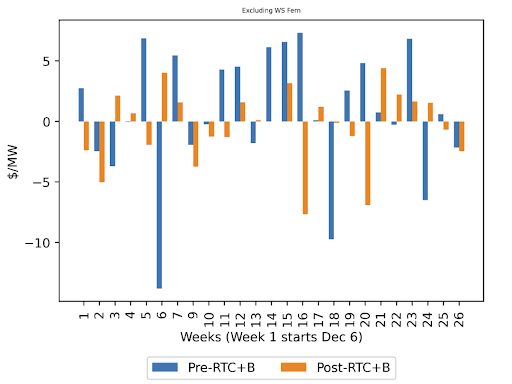 Figure 7: Average Energy DART spreads for pre- and post-RTC+B for ERCOT hub average.
Energy DART spreads were normalized by ERCOT load to account for differences in load between the pre- and post-RTC+B periods. The results of this analysis were nearly identical to those presented in Figure 7, indicating that fluctuations in system load did not have a significant impact on prices between analysis periods.
AS Price Analysis
This analysis period for AS uses the same dates as the energy price analysis and relies on market-clearing prices for capacity (MCPCs) provided by ERCOT, with Winter Storm Fern data continuing to be excluded. Prior to RTC+B, AS DART spreads did not exist because AS markets did not yet exist in real-time. Comparing the DAM AS prices pre- and post-RTC+B is a reasonable alternative to understand the impacts of RTC+B.
AS data also indicates that co-optimization is lowering prices, and the forecasted price savings are beginning to materialize. Figure 8 illustrates the average DAM AS prices, which show that generally the cost of AS is down post-RTC+B. Only non-spin was higher post-RTC+B. According to a report given on December 15, 2025, by Potomac Economics, the independent market monitor for ERCOT, over-procurement of NSPIN beyond the AS plan is driven by AS duration requirements and SCED procuring beyond the AS plan due to ASDC characteristics. Put another way, a miscommunication between the AS plan and the NSPIN ASDC creates a false shortage of NSPIN, leading to elevated prices and overprocurement. Stakeholders continue to evaluate potential solutions to rectify this issue.
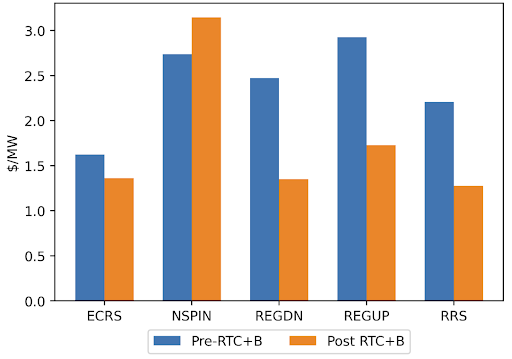 Figure 8: Average DAM AS prices pre- and post-RTC+B broken out by AS product.
With more granularity, some additional trends become evident. Figure 9 shows the weekly average AS DAM values for the analysis periods. For all AS products, post-RTC+B was generally higher right after go-live; however, after the first few weeks, post-RTC+B values were usually much lower than their historical counterparts.
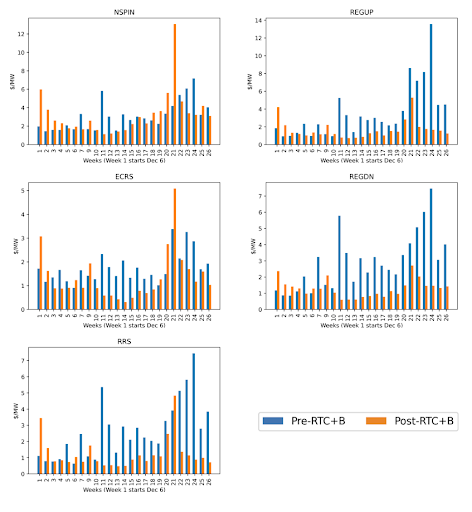 Figure 9: Average weekly DAM AS prices pre- and post-RTC+B for all AS product types.
Generation Mix Analysis
A closer look at generation before and after RTC+B reveals several notable trends. Coal, natural gas, and nuclear all declined between 1-2% each as a share of the total generation mix. On the other hand, solar and ESRs increased approximately 5% and 1%, respectively. Wind and hydro shares remained relatively unchanged. Figure 10 shows each major generation type, along with the average for each analysis period. Generation data was sourced from ERCOT's 60-Day SCED Disclosure Reports, with values normalized as a percentage of total generation. ESR trends include discharging only.
Something that most generation types had in common was that post-RTC+B swings in magnitude tended to be less than pre-RTC+B. This shows that RTC+B is capable of a more efficient dispatch that limits large swings in resource types. This is especially notable for natural gas and wind. Conversely, ESRs saw more volatility in dispatch. This is a positive development, since one of the main benefits of batteries is helping to mitigate the swings from intermittent renewable resources like solar and wind. This is yet another positive metric that RTC+B is effectively dispatching resources.
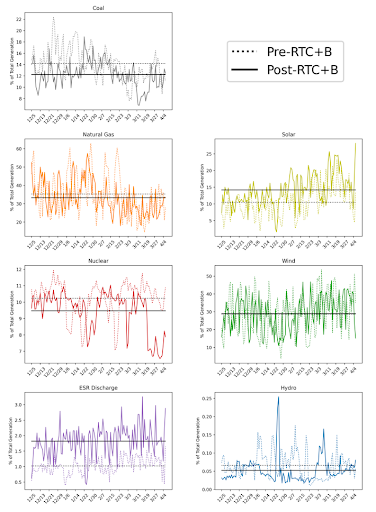 Figure 10: Percent of total generation by resource type for pre- and post-RTC+B analysis periods. The average percent of generation over the analysis periods is also shown.
Virtual AS Observations
Virtual AS, or AS-only offers, are new to ERCOT with the implementation of RTC+B. While allowing for better AS price convergence between DAM and SCED, they have also opened up a new potential revenue stream for virtual traders. Virtual AS data was sourced from 60-Day DAM Disclosure Reports.
Based on the data shown in Figure 11, the participation in virtual AS is growing. Initial participation started out at around 5 QSEs, but has steadily grown to around 18 QSEs participating consistently on a daily basis. There was a noticeable decrease in participation during Winter Storm Fern, which makes sense given the extra uncertainty associated with inclement weather. It's also interesting to note that most QSEs submitting AS-only offers receive AS-only awards.
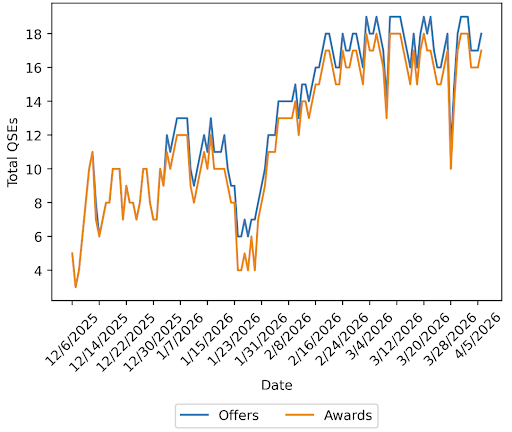 Figure 11: Total QSEs participating in virtual AS since RTC+B implementation.
While participation in virtual AS has been steadily increasing, the total number of MWs offered in the DAM has remained fairly constant over time. Figure 12 shows the breakdown of virtual AS offers by AS type. The majority of offers are from NSPIN, which is likely due to it being one of the first deployed AS products and the overprocurement issues discussed previously.
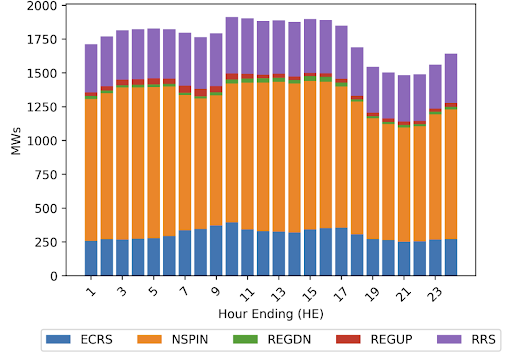 Figure 12: Total average virtual AS offers by AS type and operating hour.
Looking at the virtual AS-only awards reveals an important and surprising observation: to date, there have been no ECRS or RRS virtual AS awards, despite offers for both. It appears that QSEs have been unable to offer virtual offers for these products in a way that is economically beneficial for them and still competitive enough to receive awards. Only 122 days of disclosure data were available when the analysis was completed, leaving about 8 months of the year unknown. It is possible that summer trends could create more favorable conditions for virtual ECRS and RRS.
Figure 13 shows the award percentage for NSPIN, REGDN, and REGUP. NSPIN has the highest average award percentage at just above 70%. This is perhaps slightly inflated due to the NSPIN issues mentioned above. REGUP had the lowest overall award percentage, but it appears to be fairly comparable to REGDN at the end of the day.
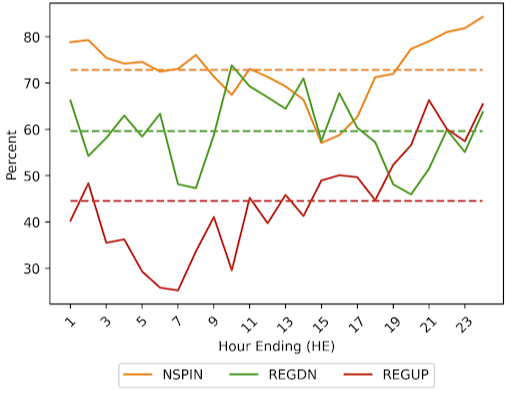 Figure 13: Percent of offered virtual AS MWs that received awards for an average day, broken out by operating hour. The average awarded percentage is shown by the dashed line.
Conclusion
RTC+B is reshaping ERCOT markets by providing increased efficiency in price formation and resource dispatch. Pre- versus post-RTC+B price data indicates that prices are overall down post RTC+B with less volatility as well. There has been an improvement in resource dispatch, with more ESR utilization and reduced swings in resource dispatch. And lastly, the addition of virtual AS in the DAM created an additional revenue stream for virtual traders, with three of five AS products consistently receiving virtual awards.
Although it is still early in the RTC+B implementation, the first six months of data indicate that its intended benefits are beginning to emerge and are likely to continue as the market matures.
Want to dig into RTC+B trends yourself? Request a demo to explore ERCOT price, generation, and virtual AS data firsthand.
Meet the Author