


This is the first article in Yes Energy’s summer demand series covering demand-side market complexities. Alex Bennitt, Product Manager for Yes Energy, breaks down the macro-level demand trends, load projections, and market uncertainty that’s impacting traders, asset developers, and resource planners.
Power markets are continuing to see a rise in public discourse, and for good reason. An aging grid experiencing rapid build out of non-traditional generation, paired with hyperscaler interconnection queues, has sent demand projections into hard-to-comprehend territory. This makes for nationally appealing coverage of an industry that wasn’t talked about as much in the past decade.
With a lot of moving parts and different market dynamics contributing, this sets the stage for an era of complex load growth.
What makes this so complex?
-
Rising base load
-
Data center buildout
-
Data center operations
-
Data center queues
-
Changing generation mix
It’s clear that most of the complexity is driven by data centers, which have jammed up interconnection queues and sent ISO demand projections through the roof. When comparing ISO forecasts against historical all-time peak load, most ISOs are projecting peak load to grow 5-25% in the next 5 years, and 10-33% in the next 10 years. That’s PEAK load! ERCOT’s long-term demand forecast has a ~50 GW increase in the next five years (~60%), and continues to grow with each further forecast.
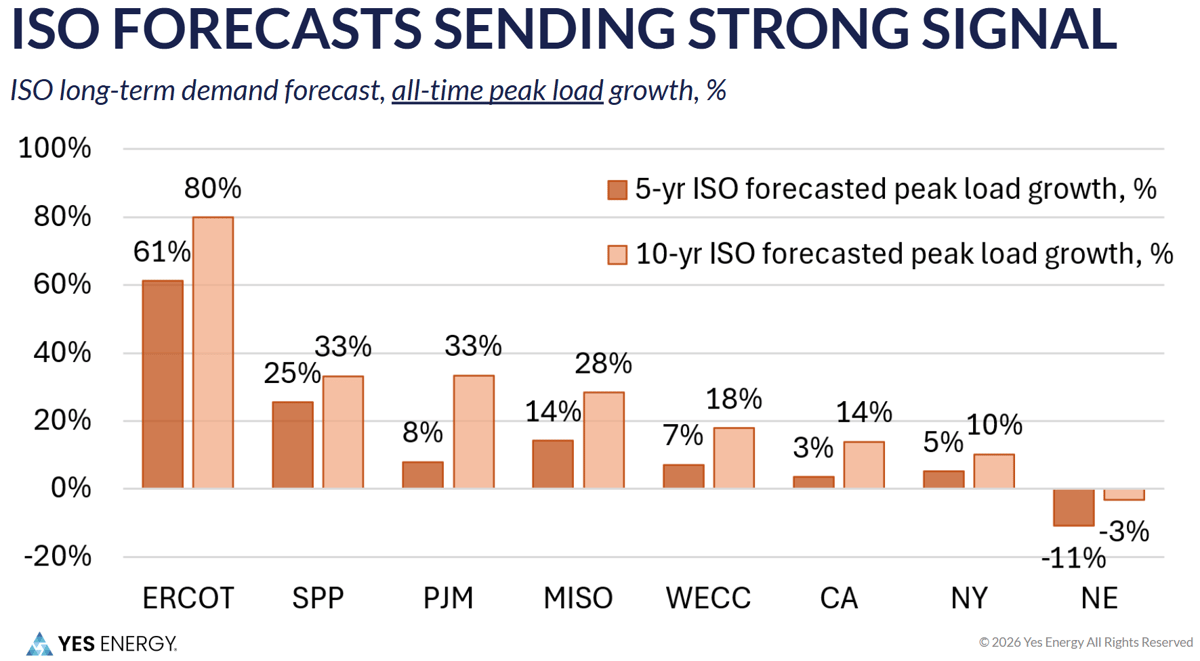 Note: Moderate demand forecast scenarios used and compared against historical peak load: ERCOT - Long Term Load Forecast, SPP - 2025 Integrated Transmission Planning Report, PJM - 2026 Load Forecast Report, MISO - 2026 Long Term Load Forecast, WECC - 2024 Western Assessment of Resource Adequacy, CAISO - 2024 Integrated Energy Policy Report, NYISO - 2025 Power Trends, NEISO - 2025 CELT Report
Just how much will load grow?
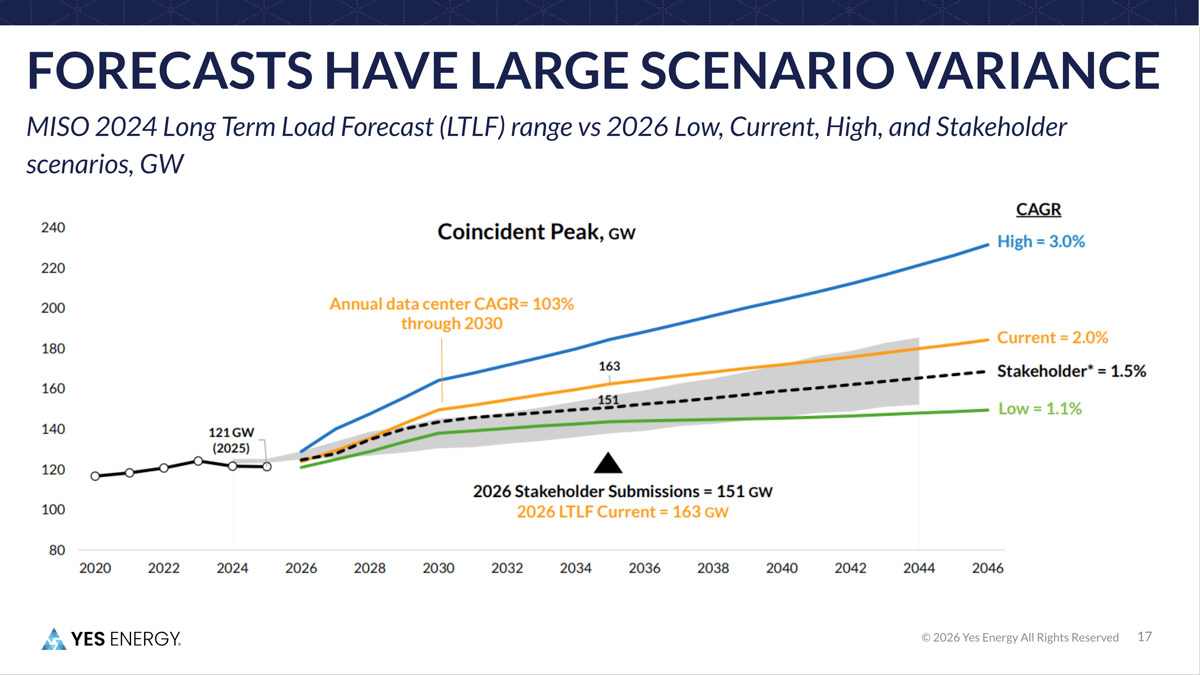
For power markets, this is the “shot heard round the world.” A strong message is being sent to market participants and the broader general public about what the next five to ten years may look like. Which gets to a pivotal point regarding these forecasts: There’s major uncertainty on how much load will grow. Not only are new demand forecasts rising rapidly, but the scenario ranges are widening. High side scenarios are much higher than the numbers viewed above and are often what shows up in attention-grabbing headlines. Meanwhile, even low side scenarios still have robust growth. Using an example out of MISO’s most recent long-term load forecast, the gap between high and low side scenarios is over 100 GW on a 20-year forward timeframe.
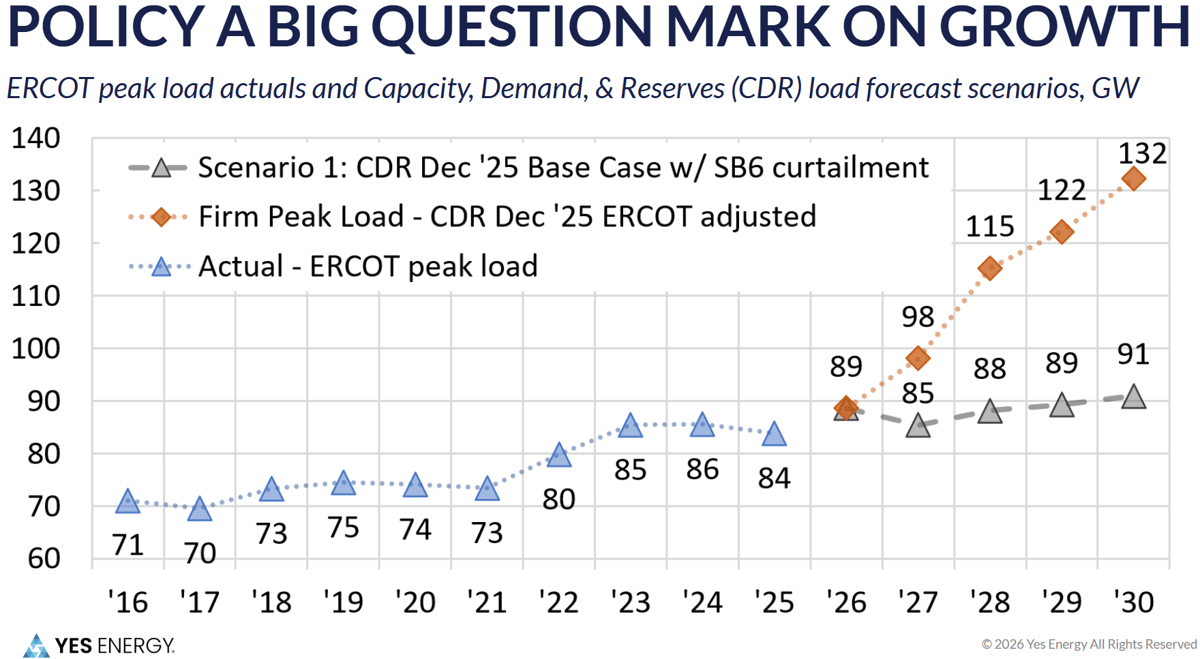
Part of the reasoning behind wide forecast ranges is uncertainty regarding local, state, and federal policy. Sweeping regulation, market design, etc. can quickly change what the next decade looks like from a load growth perspective. Earlier this year, market participants got the first view of the impact that sweeping regulation could have in ERCOT with Texas Senate Bill 6 (SB6). This would give ERCOT the authority to forcibly curtail large loads during certain energy emergency alerts (EEAs). Now demand forecasting in the Capacity, Demand, and Reserves report reflects a scenario with this authority. The difference? 40 GW. ERCOT is projecting 132 GW of firm peak load by 2030. With SB6 authority that number drops to 91 GW by 2030.
With this many moving parts, it’s only fitting to dedicate a whole summer demand blog series to dig into the details. The rest of this article will highlight macro load growth, data center capacity, and generation capacity buildout across the United States. Then stay tuned for more detailed articles covering realistic demand projections, data center operational data, and crypto mining's impact on the grid.
Part 2: Demand projections
Part 3: Hyperscaler operational data
Part 4: Crypto mining operational data
Rising Base Load
Outside of the Northeast, summer 7x24 base load has grown 5-20% on a four-year basis across most of the United States. ERCOT has seen strong weather adjusted load growth – 19% on a four-year and 34% on a 10-year basis – due to industrial and commercial load growth (mainly data centers), combined with population growth in the state. This is in contrast to California and the Northeast, which saw flat to declining base load.
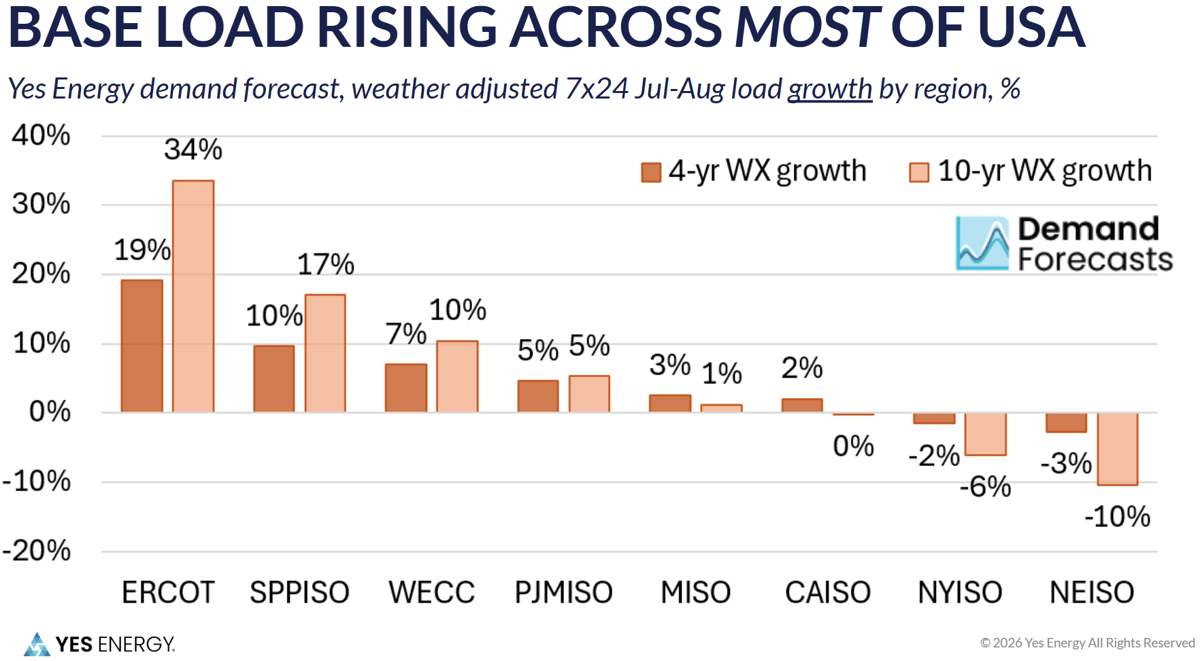
Note: Weather adjusted base load provided via our in-house demand forecasting capabilities
Why is base load flat to declining in California and the Northeast? Large behind-the-meter (BTM) solar capacity is pushing down grid served load. These ISOs lead the nation in BTM solar capacity due to favorable policy incentivizing or requiring BTM solar installations. The result is 9-18 GW of capacity slowing load growth in these regions. For NEISO, BTM solar has pushed demand well below the ISO’s mid 2000s peak.
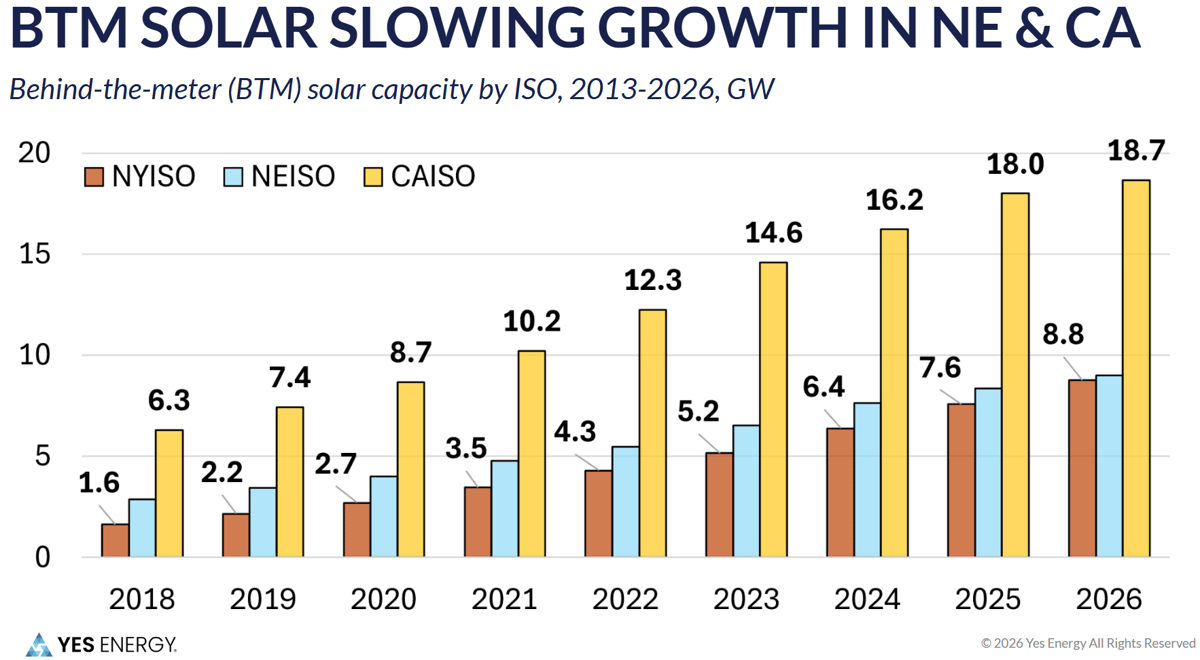
Note: BTM solar capacities compiled from the following sources: CAISO - California Public Utilities Commission Distributed Generation Statistics, NYISO - 2026 Power Trends, NEISO - Distributed Generation Forecast (2017-2026 reports)
Data Center Buildouts
What’s driving base load growth? One major component is data center buildout, which neared 50 GW at the end of 2025, up from roughly 11 GW in 2018, a 5x increase in under a decade. That number could grow to 77 GW in the next two years with over 25 GW of data center projects under construction and projected to come online by 2027. One important note is that this is capacity, not realized load, with operational data showing that most data centers operate at 40-70% of their reported capacity, likely indicating that operators like to have headroom with their interconnection amounts.
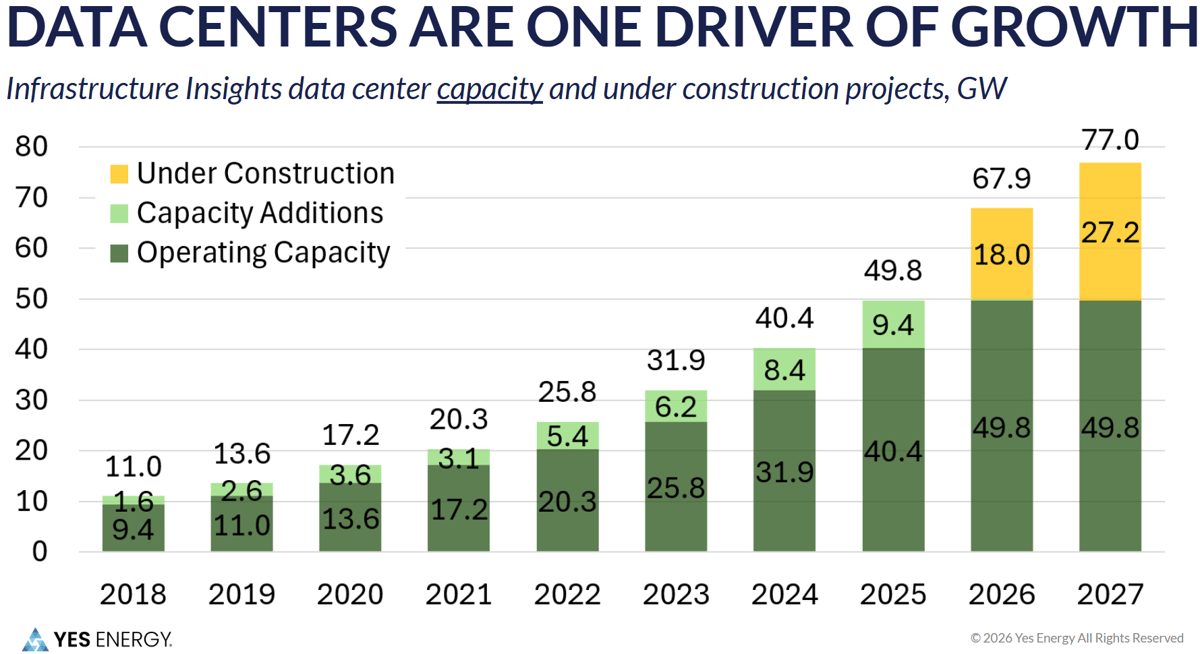
Note: Data center capacity and under construction data provided via our in-house infrastructure tracking capabilities
Where is this data center capacity located? It should be no surprise that PJM leads the way in connected data center capacity. PJM’s footprint is home to “data center alley” outside of Washington, DC. PJM currently hosts ~16 GW of capacity, and could see that number grow to over 23 GW in the next two years. ERCOT has the most capacity under construction around 9 GW, with 19 GW possible by 2027. MISO will see a lot of new capacity connected in the next two years, with 8 GW under construction, almost 2x the current connected level of 4.7 GW in the ISO. To round things out, California and the Northeast have minimal data center capacity connected, and not a lot of requests to connect in these regions due to unfavorable policy and macroeconomics for data centers.
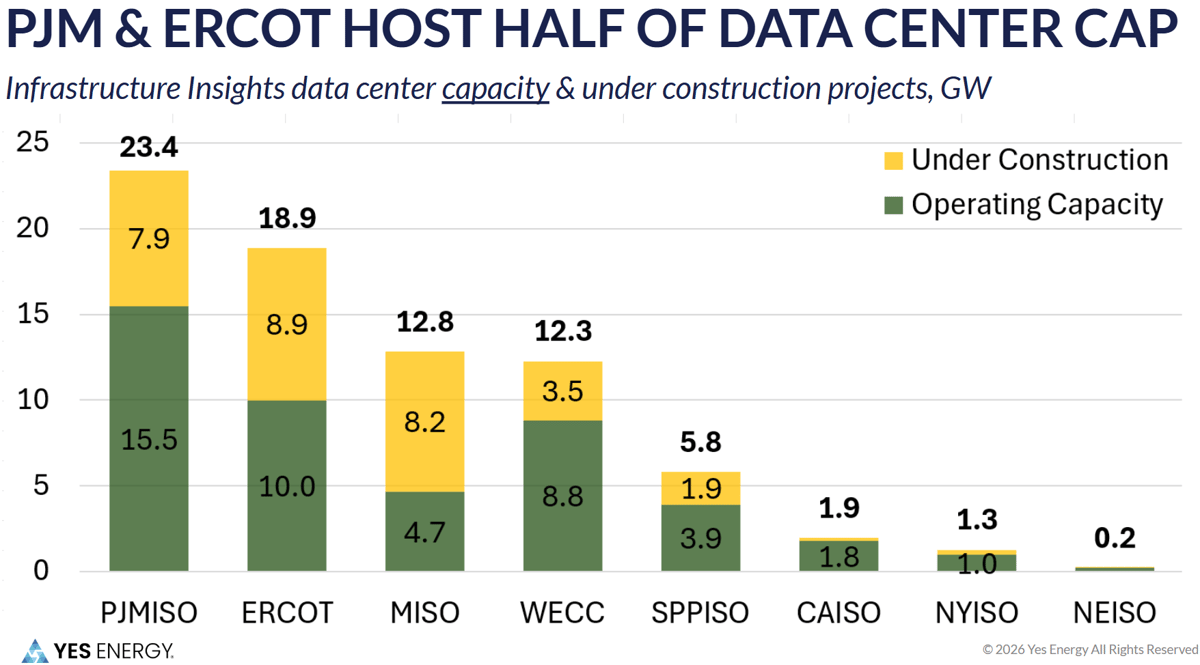
Note: Data center capacity and under construction data provided via our in-house infrastructure tracking capabilities
Interconnection Queue Challenges
The breakdowns of data center capacities above are a hyper simplified way to view an otherwise messy reality of interconnection queues – they’re filled with projects that may never see the light of day. ERCOT alone has over 400 GW of requests for large load interconnections, most of which are data centers. This isn’t a new phenomenon, as generation interconnection queues have set the precedent for hard-to-interpret data the last decade, and now data centers have joined the party. Interconnection queues are a game in themselves, and jamming up the queue with projects is a logical conclusion for markets where a turnkey ready interconnect has inherent value that some entities will pay for when time-to-connect is of the utmost priority.
The views above are filtered down to under construction projects to provide a more realistic, and simplified view of what’s actually happening on the grid in the near-term future.
Supply Growth
Another component contributing to complex load growth is on the opposite side of the market equation… supply, and it wouldn’t be a full market outlook without at least briefly touching on the changes to the stack that are creating a case where the whole is greater than the sum of the parts.
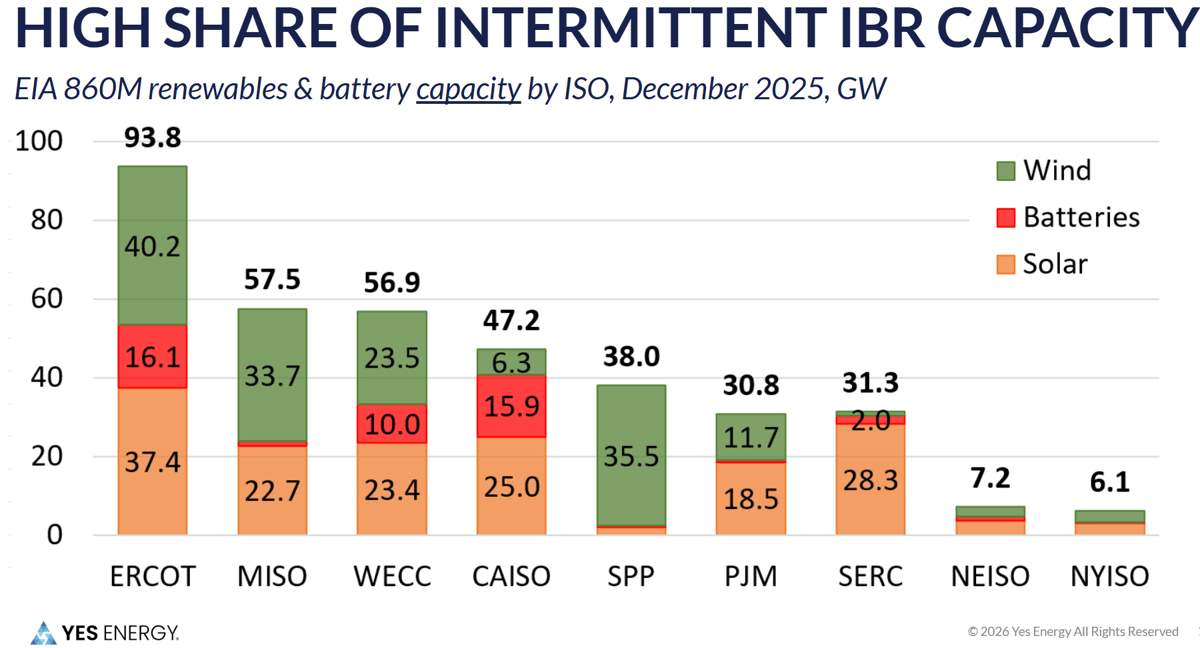
In certain ISOs, the generation mix has been flooded with solar, wind, and battery generation that’s creating an outsized impact on grid operations and market pricing. Wind generation growth took off in the mid 2010s, and recently it’s been solar’s turn to shine, with over 100 GW of grid-scale capacity added in the last 5 years nationwide. Most ISOs have added 30-40 GW of total generation capacity across all technologies in the last 5 years, with ERCOT leading the pack by a wide margin (~65 GW built out). As is the trend for any chart comparing ISOs across the nation, NY and NE trail far behind with ~5 GW added each. It’s important to note that NY and NE are much smaller ISOs, but are still seeing relatively lower additions due to less attractive market economics and locational renewable viability. 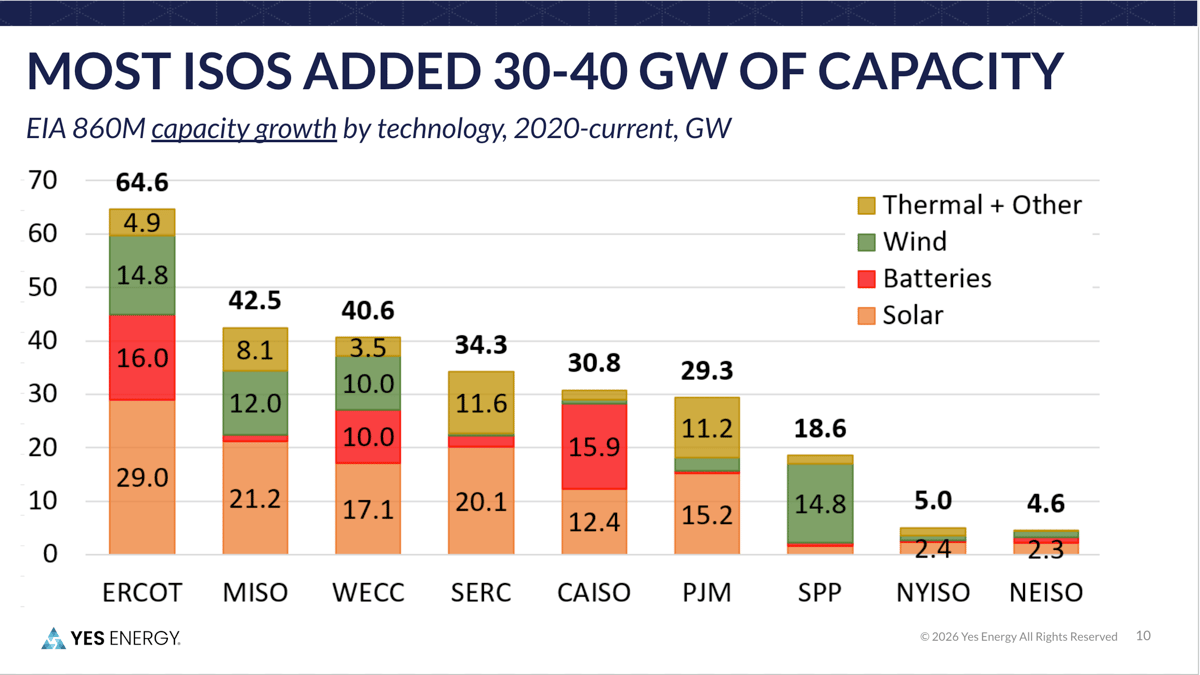
The generation build out momentum continues when looking at planned capacity additions by 2030, with another 100 GW of solar planned. Batteries start to make their way onto the scene in ISOs with higher solar capacity, as this resource is a good offset to solar’s generation curve, able to soak up midday solar and discharge it as the sun sets. A surprise in the forward view is that the second highest planned “resource” is traditional thermal with over 60 GW planned.
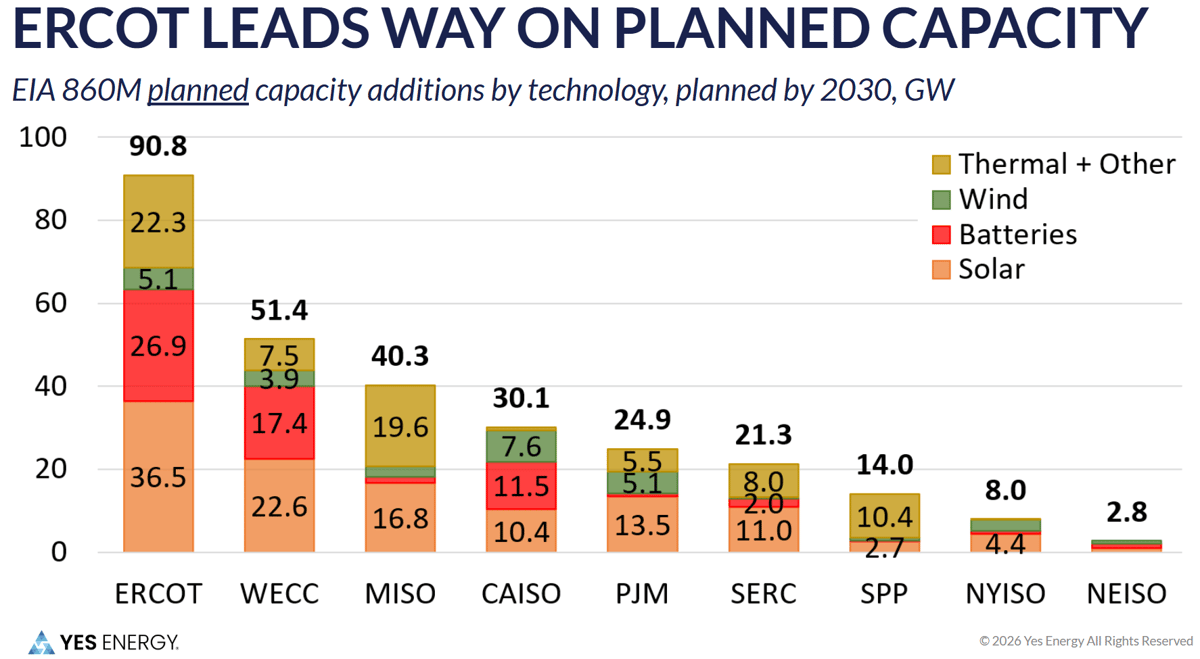
Part of the reason why traditional thermal is the second highest resource is because most of the capacity built over the last decade is wind, solar, and batteries – technologies that are intermittent and lacking the physical inertia of rotating turbines. ISOs have added 30-60 GW of these resource types, but they get scaled down in reliability calculations due to the simple fact that if the sun doesn't shine (or it snows in Texas) and the wind doesn’t blow, then you’ll see major reductions in output from these resources. Plus: Solar has a daily drop when the sun sets, and ISOs that cruise through midday demand peaks with 30 GW of solar are sweating out sunset and the shift back to traditional thermal resources.
Conclusion
For the last 20+ years, the grid experienced almost no demand growth, and suddenly all of that has changed. What hasn't changed is the need to bring clarity to the noise.
If you want to learn more about how complex loads are reshaping the grid, watch the full on-demand webinar or request a demo.
Next in our summer demand series: A deep dive into realistic demand projections, how hyperscale data centers actually operate on the grid, and a crypto mining case study.
Meet the Author