


The rebuilds of PPL’s Berks–Lavino 69 kV and South Akron-Millwood-Strasburg 230 kV lines in Pennsylvania represent a good example of how transmission investment can potentially reshape congestion patterns and price formation in PJM.
From 2020 through 2025, the BOONETWN–SREADING BOO-SRE A 230 kV, Real Time constraint (all contingencies) showed persistent and, at times, extreme congestion costs. Following the completion of both line projects in September 2025, the constraint appears to have stopped binding.
This case highlights:
-
How transmission projects evolve over time
-
Strong candidate scenarios for power flow modeling
-
The direct link between grid topology changes with congestion trading opportunities and risk mitigation
-
How Yes Energy’s tools can give you both a leading indicator and a real-time confirmation of grid changes affecting congestion
Why Infrastructure Tracking Matters More Than Ever
For power traders and utilities, changes in transmission, generation, and load infrastructure are among the most powerful and underutilized sources of market edge.
The Challenge
Tracking projects like the Berks–Lavino and South Akron-Millwood-Strasburg line upgrades are not straightforward:
Fragmented data sources: Information is spread across PJM planning reports, PUCT filings, construction queues, and utility reports
Constant revisions: In service dates shift and scopes change
Long timelines with uncertainty: Projects can take 2–10+ years, with multiple false signals or changes along the way
Nonlinear market impact: A project may have zero impact—until the day it goes in service and alleviates a multi-million-dollar constraint or changes power flow in the area
Topology complexity: Understanding why it is important to consider transmission projects in a sensitive area with many historical constraints and contingency pairs requires careful examination, and ideally, a power flow model
Why It Matters
Despite the complexity, the payoff is enormous:
Forward congestion forecasting: Anticipate places where constraints could persist, disappear entirely, or even move down the line
FTR and congestion strategy alignment: Avoid holding positions that are structurally at risk of collapse, or have the opportunity to reduce risk
Fundamental price modeling: Incorporate real grid changes rather than relying solely on historical patterns
Utility planning & risk management: Understand how upgrades affect reliability, flows, and exposure to congestion costs
The Yes Energy Advantage
At Yes Energy, we recognize how time-consuming it can be to efficiently track the ever-evolving power grid.
That’s why our dedicated Infrastructure Insights team is focused exclusively on energy infrastructure project tracking:
-
Continuous monitoring of PJM and other ISOs across North America
-
Normalization of messy, evolving project data
-
Tracking of ISD changes and scope adjustments throughout the development cycle
-
Project probability scores to filter out the noise
Infrastructure Insights transforms raw data from hundreds of different data sources into actionable intelligence—giving our clients clarity on when and how the market will change.
The Constraint in Question
The BOONETWN–SREADING BOO-SRE A 230 kV constraint was a binding constraint in eastern PJM from 2020 to 2025, most notably under the Lauschtown T3 contingency. While factors such as weather, generation, and transmission outages played a role, two transmission projects highlighted in Infrastructure Insight, Berks–Lavino 69 kV and South Akron–Millwood–Strasburg 230 kV line rebuilds, stand out as key drivers.
Historically active with several different contingencies, the constraint shows a clear seasonal summer pattern but disappears entirely after September 2025. The timing suggests a strong relationship with the completion of these line rebuilds, as the constraint has not bound in real time for seven consecutive months.
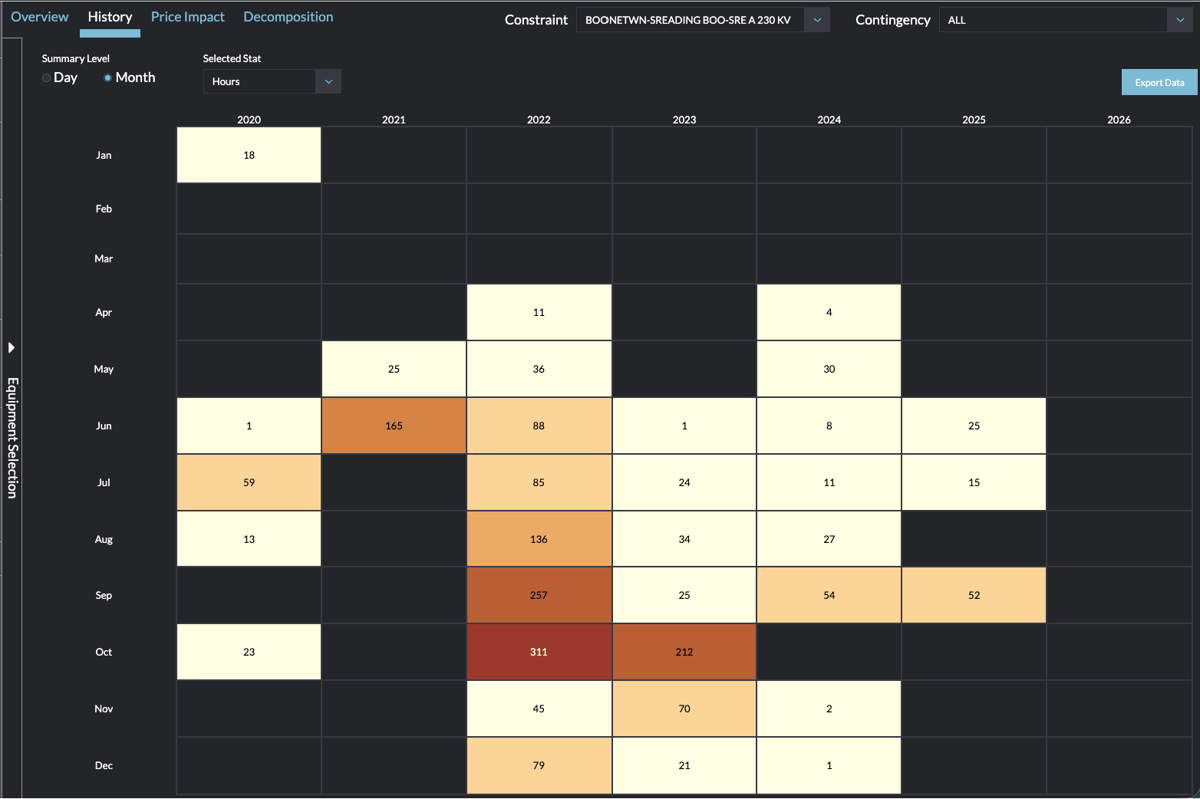 Figure 1: Historical Congestion Hours & RT Spread Profile (2020–2025)
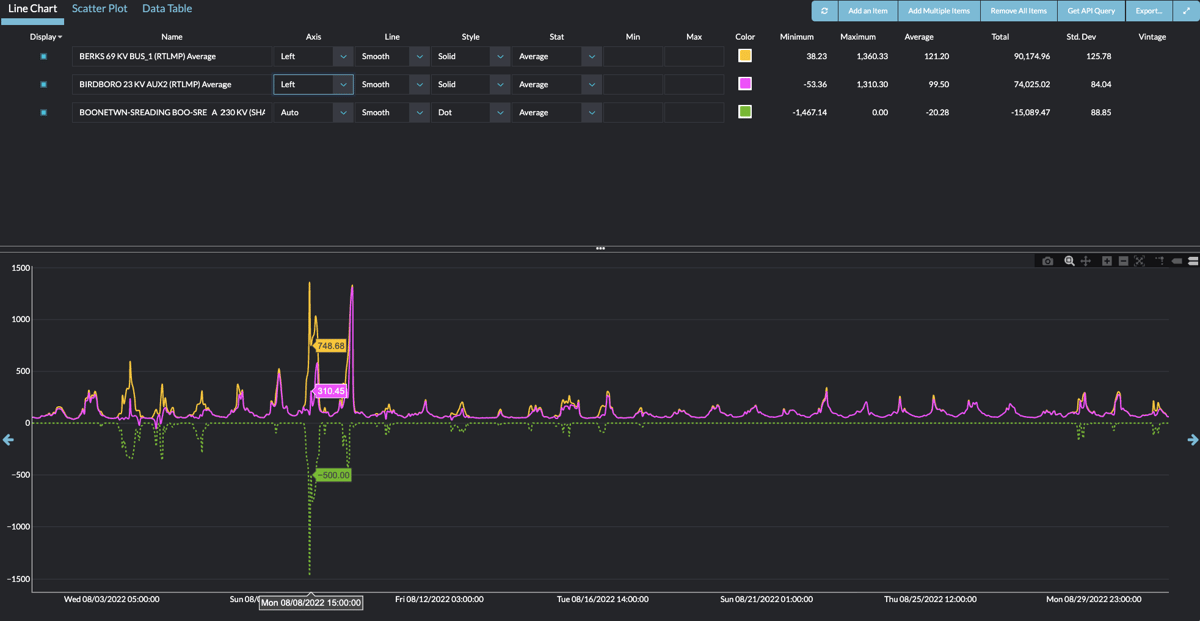 Figure 2: Real Time LMP spread between BERKS 69 KV BUS_1 and BIRDBORO 23 KV AUX2 on August 8th, 2022, HE15 when the constraint was binding.
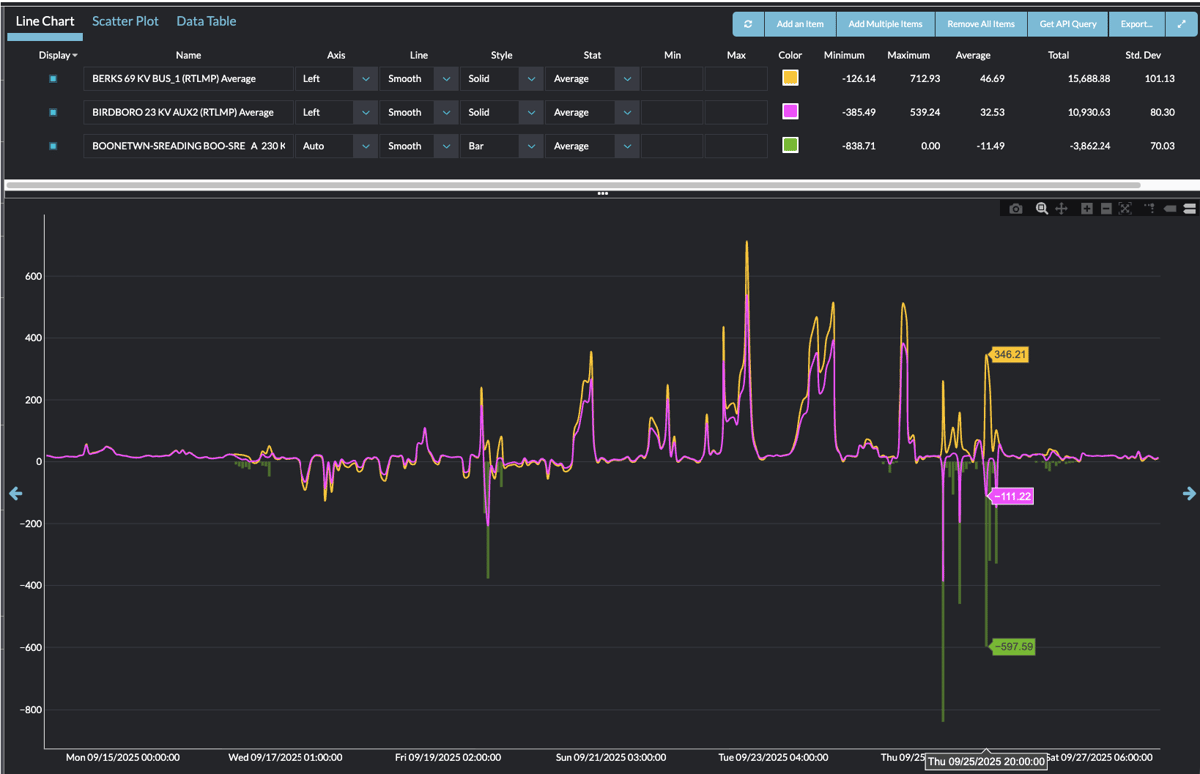
Figure 3: Real Time hourly LMP spread between BERKS 69 KV BUS_1 and BIRDBORO 23 KV AUX2 on September 25th, 2025, HE20 on one of the last times the constraint was binding.
This behavior reflects:
-
Overload on BOONETWN–SREADING BOO-SRE A 230 kV for the loss of LAUSCHTOWN T3 230/500 kV
-
Limited paths for power delivery to Reading, PA and Lancaster, PA areas
Key Observations about Transmission Projects at Berks and South Akron
Berks-Lavino 69 kV Upgrade
Utility: PPL
Scope: Rebuild the Berks–Lavino 69 kV line
Timeline: Announced 2015, Under Construction late 2024/early 2025, Operating September 2025
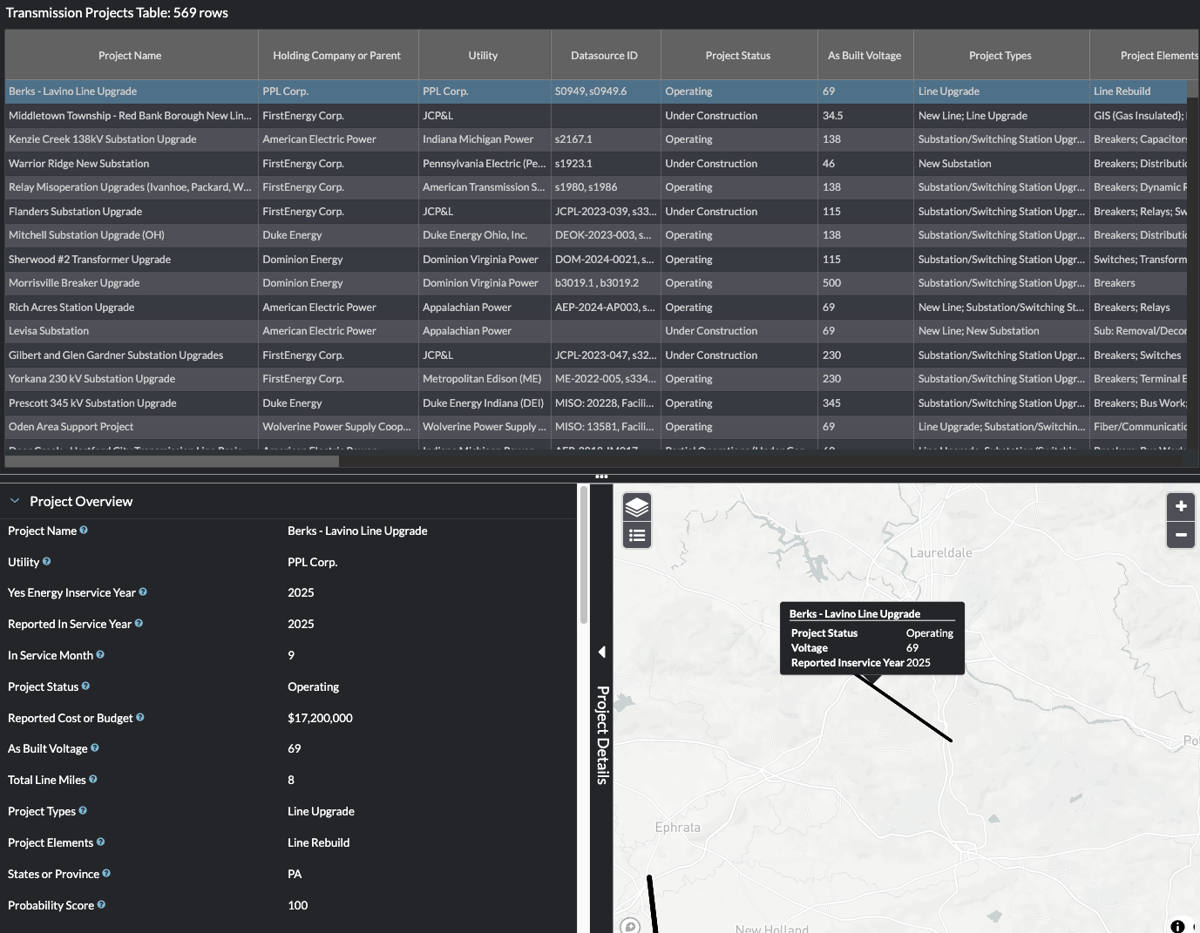
Figure 4: Infrastructure Insights view of the Berks-Lavino 69 kV Line Upgrade.
South Akron-Millwood-Strasburg Rebuild
Utility: PPL
Scope: Rebuild the South Akron-Millwood-Strasburg 230 kV line
Timeline: Announced 2020, Under Construction early 2025, Operating September 2025
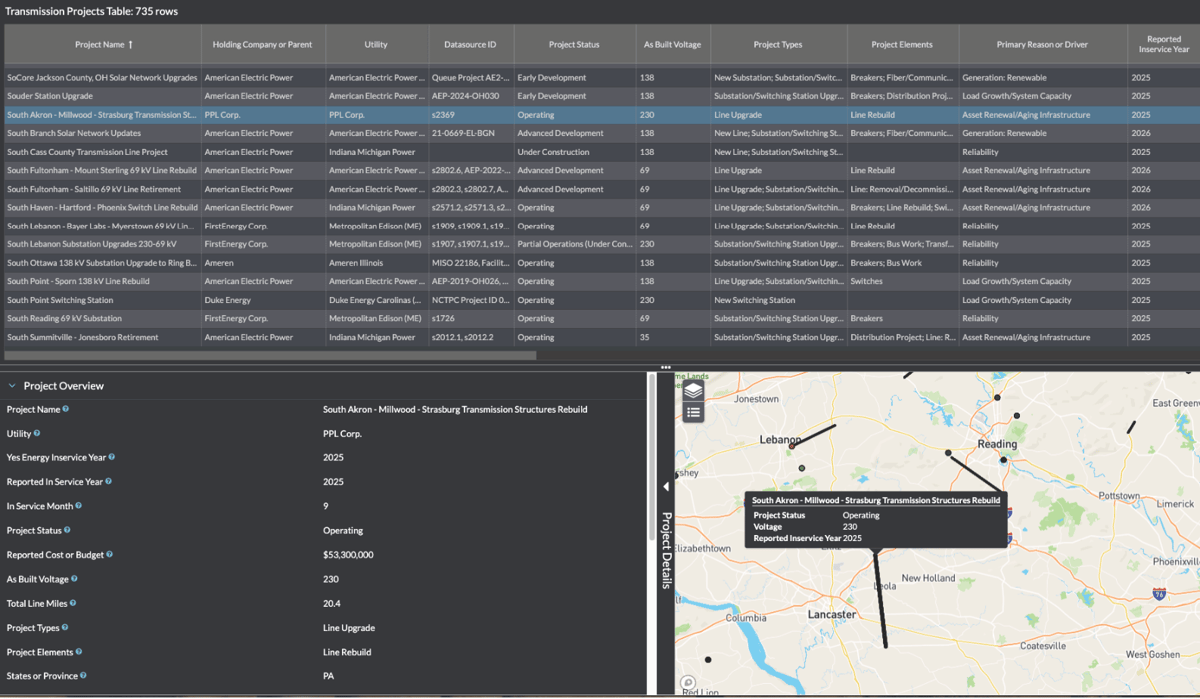 Figure 5: Infrastructure Insights view of the South Akron-Millwood-Strasburg 230 kV Line Rebuild.
Key Outcome
Once the rebuilds are energized and in service, the constraint appears to be alleviated. However, the BOONETWN–SREADING BOO-SRE A 230 kV real-time constraint has historically been most active during hot weather conditions. Although the addition of two new lines is expected to improve power delivery to high-demand areas, the true test will come under high load in the coming months. That said, such upgrades can shift congestion elsewhere, potentially creating new bottlenecks—especially in areas where infrastructure is aging or has been compromised, as seen with the Berks–Lavino 69 kV line following fire damage.
Market Impact: Before vs. After
Pre-Upgrade (2020–2025)
-
Persistent congestion with high volatility
-
Repeatable seasonal spikes
-
Strong driver of nodal price separation
Post-Upgrade (2025–2026)
-
Congestion appears to be alleviated on the constraint
-
2026 summer months will test this theory
Key Takeaways for Market Participants
1. Infrastructure Changes Drive Structural Market Shifts
-
This was not noise; it was a permanent change in price formation.
2. Identifying Projects is Easy—Tracking Them Accurately and on Time is the Real Challenge
-
Timelines change repeatedly
-
Scope evolves
-
Time spent trading vs gathering data
-
Market impacts are not obvious without tools, such as PowerSignals®, to conduct deep analysis
3. Dedicated Tracking Is a Competitive Advantage
-
Without systematic tracking, it’s easy to:
-
Overestimate congestion persistence
-
Miss-timing on position unwinds
-
Hold long-dated positions that are structurally at risk of collapse
Conclusion
The Berks–Lavino and the South Akron-Milwood-Strasburg rebuilds demonstrate how transmission projects can affect a long-standing congestion opportunity and, in turn, trading decisions and risk mitigation.
In today’s markets, where infrastructure is rapidly evolving, the ability to:
-
Track projects accurately
-
Interpret their system impact
-
Translate that into market outcomes
…is no longer optional—it’s a core competency.
See It for Yourself
With Infrastructure Insights as a starting point and in-house power flow models to confirm your assumptions, Yes Energy provides the tools to turn complex, fragmented infrastructure data into clear, actionable insight for traders and utilities.

Meet the Author