

Wholesale power prices can swing sharply from year to year, driven by weather, load growth, the mix of wind, solar, and storage on the grid, and transmission congestion. The past few years have shown how quickly those factors can shift, and why they’re so hard to predict.
The Electric Reliability Council of Texas (ERCOT) offers a clear example. Its generation stack, load profile, congestion, and pricing have all changed significantly in the past few years. Whether facing a winter storm or weathering extreme congestion, the market has battled a variety of unpredictable events.
While load growth is predicted to continue, we also see an increase in ways the grid can respond, such as by implementing more energy storage.
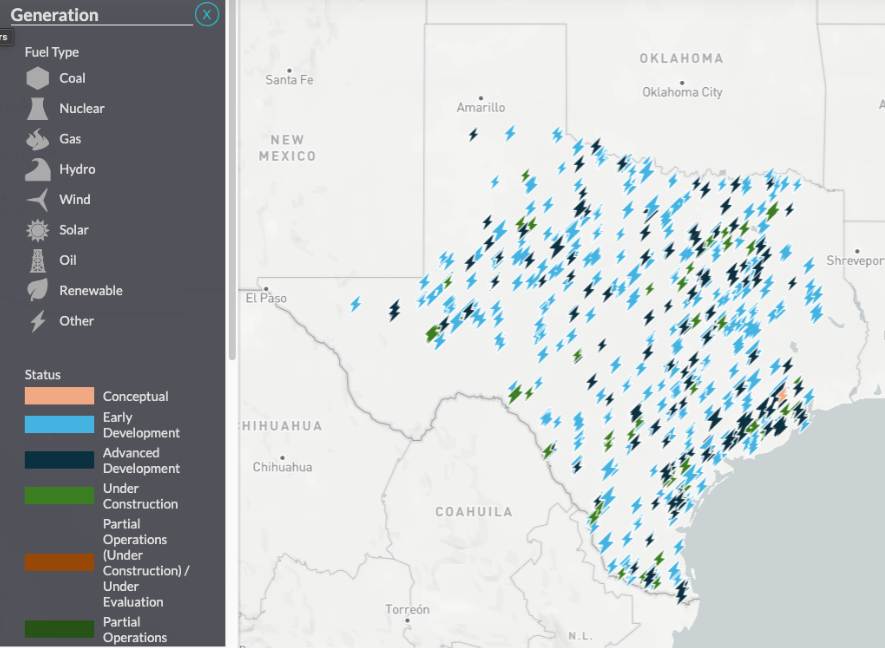
Source: Yes Energy’s Infrastructure Insights
In this analysis, you’ll see why summer 2025 prices stayed flat, what’s behind negative congestion in the South and Panhandle, and how West Texas intrazonal congestion is creating LZ_WEST premiums over HB_WEST.
Let’s delve into historic ERCOT pricing and its drivers over the past few years, and explore how you can use this data to take advantage of future pockets of opportunity.
If you want the full report, get the white paper.

Historical ERCOT Power Pricing
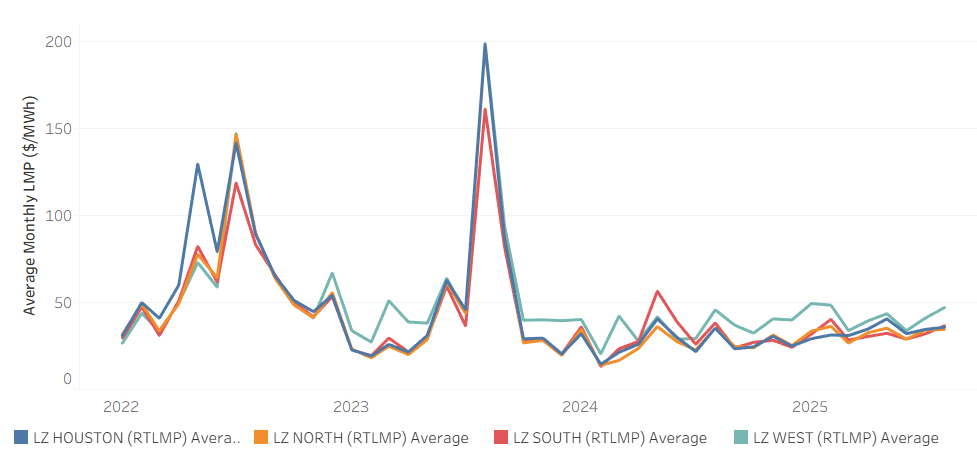
The summers of 2024 and 2025 didn’t experience the system-wide wholesale power price spikes seen in the summers of 2022 and 2023.
ERCOT Average Monthly LMPs by Load Zone, January 2022 to August 2025
Source: Yes Energy’s GridSite
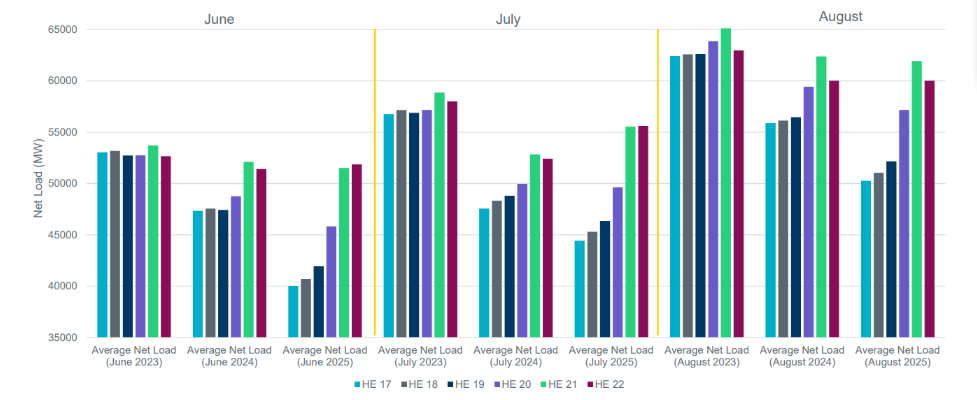
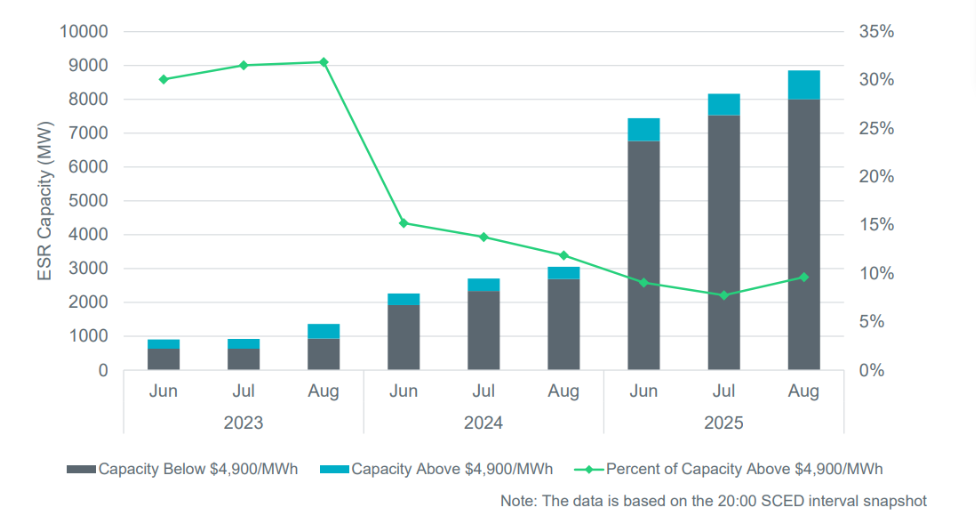
Summer 2025 had a lower peak and net loads compared to summers 2023 and 2024 due to mild summer temperatures and the continued build out of renewables, particularly solar. This, combined with the continued build out of storage resources that can offer capacity during the highest priced summer hours during the evening ramp kept prices low in summer 2025.
Net Load HE 17-22 for Summers 2023-2025
Source: ERCOT
This, combined with the continued build out of storage resources that can offer capacity during the highest priced summer hours during the evening ramp kept wholesale power prices low in summer 2025.
Energy Storage Resources Offered in HE20 during Summers 2023 - 2025
Source: ERCOT
Historical Power Congestion Analysis
Now let’s take a deep dive into congestion.
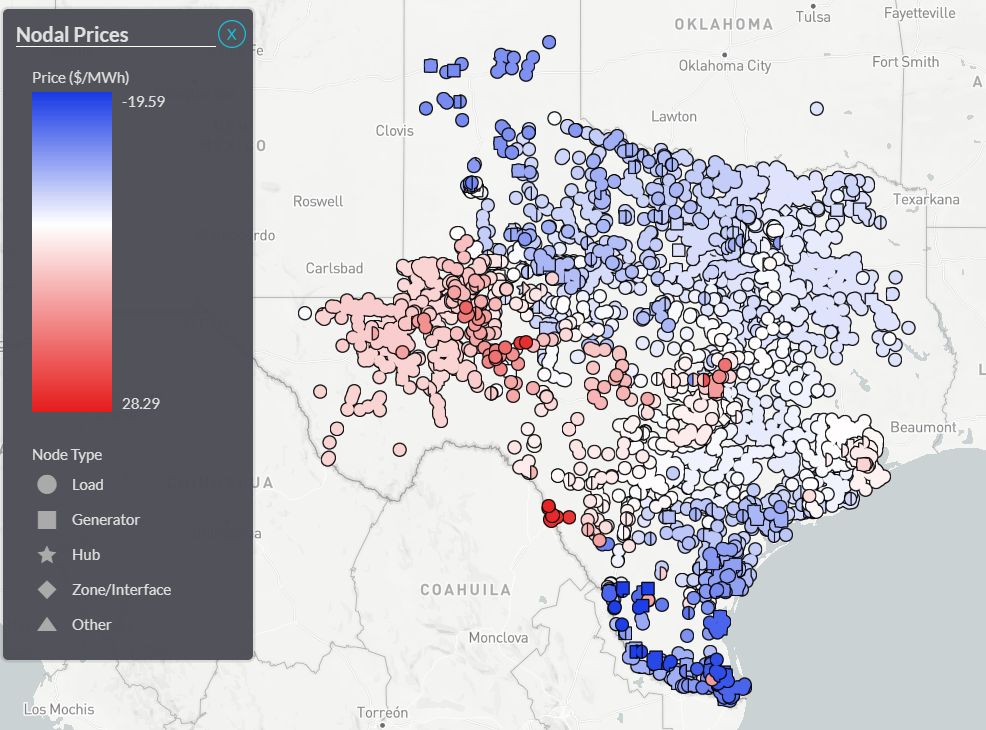
The image below shows average nodal congestion from January 2022 through August 2025. The South Zone experienced the most negative congestion, followed by the Panhandle and North Zones. Congestion in the Houston area was neutral to slightly positive, while the West Zone experienced consistently positive congestion during this period.
Average Nodal Congestion, All ERCOT Nodes, January 2022 to August 2025
 Source: Yes Energy’s GridSite
These patterns are also reflected in ERCOT zone and hub pricing, which generally show negative congestion in the South and Panhandle and positive congestion in the West. (See data below.)
Average Monthly ERCOT Hub and Zone Congestion, January 2022 to August 2025
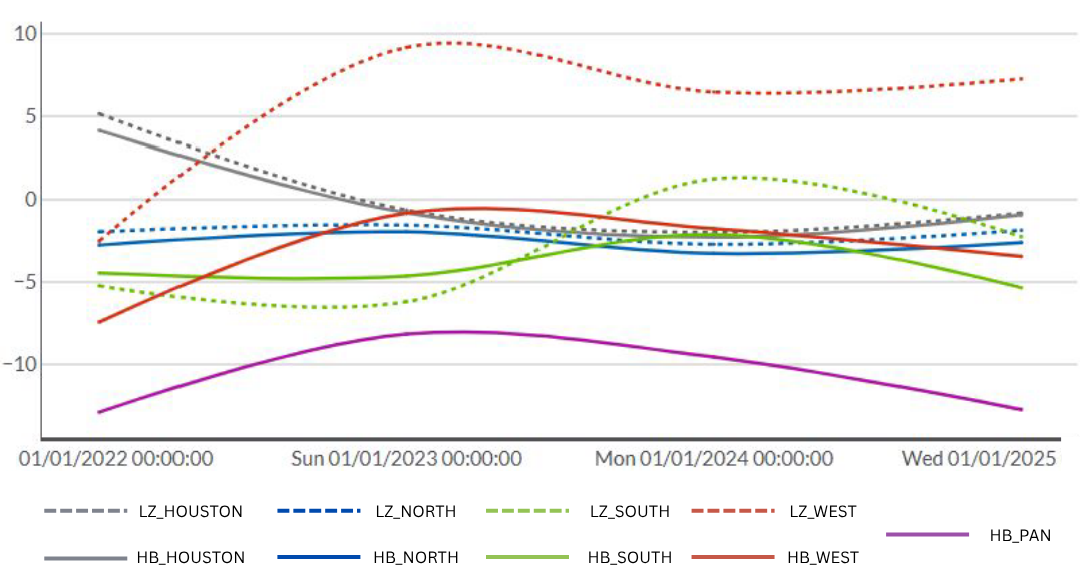
Source: Yes Energy’s GridSite. Note that this image shows the delta between the LMP and System Lambda.
What’s Driving South and Panhandle Negative Congestion?
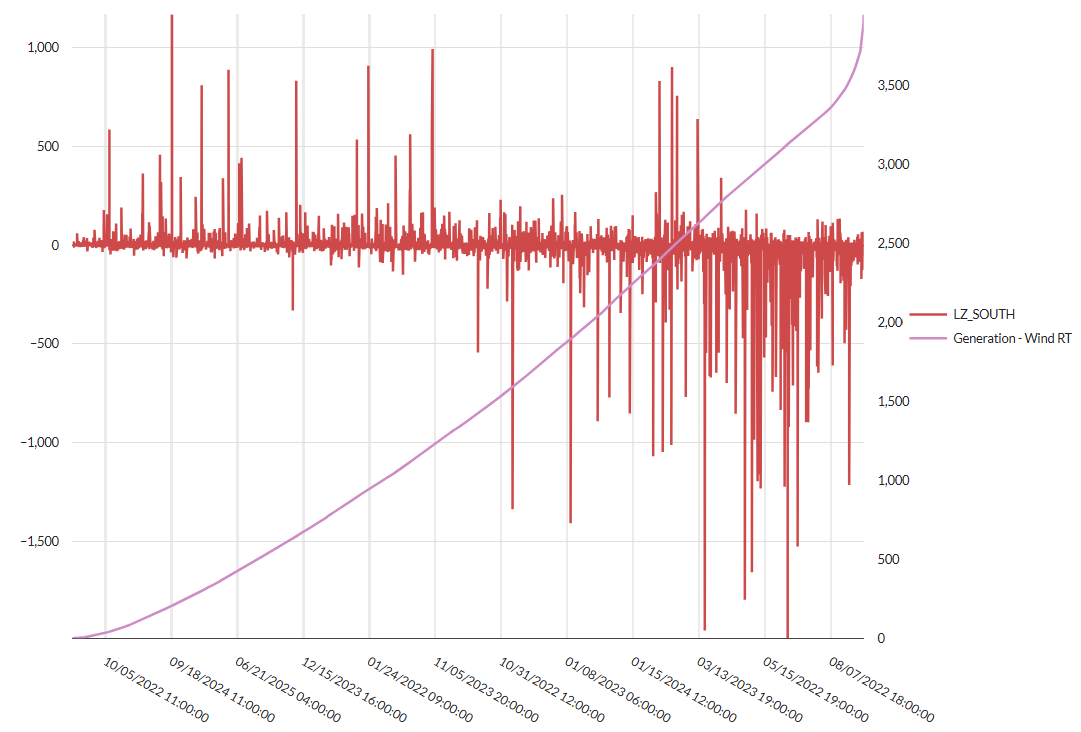
Excess wind generation primarily drove negative congestion in the south and Panhandle.
The data below shows coastal wind output sorted from highest to lowest and the corresponding LZ_SOUTH congestion. As coastal wind generation increases, negative congestion at the LZ_SOUTH price point also increases.
LZ_SOUTH Congestion vs. ERCOT Coastal Wind, January 2022 to August 2025
Source: Yes Energy’s GridSite
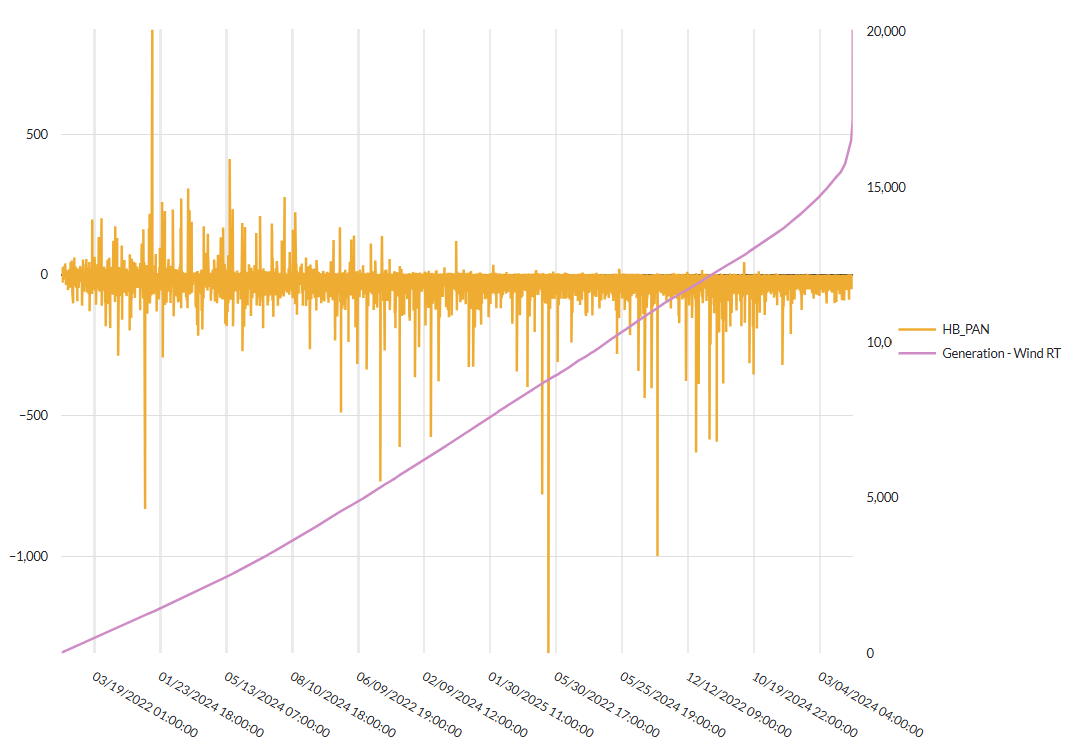
The story is similar in the Panhandle with Panhandle wind resources unable to reach the rest of ERCOT due to congestion on the generic transmission constraints (GTCs) and several key transmission lines.
Panhandle Hub Congestion vs. ERCOT Panhandle Wind, January 2022 to August 2025
Source: Yes Energy, GridSite
What Drove Positive West Congestion?
Congestion in the West Zone is more complex.
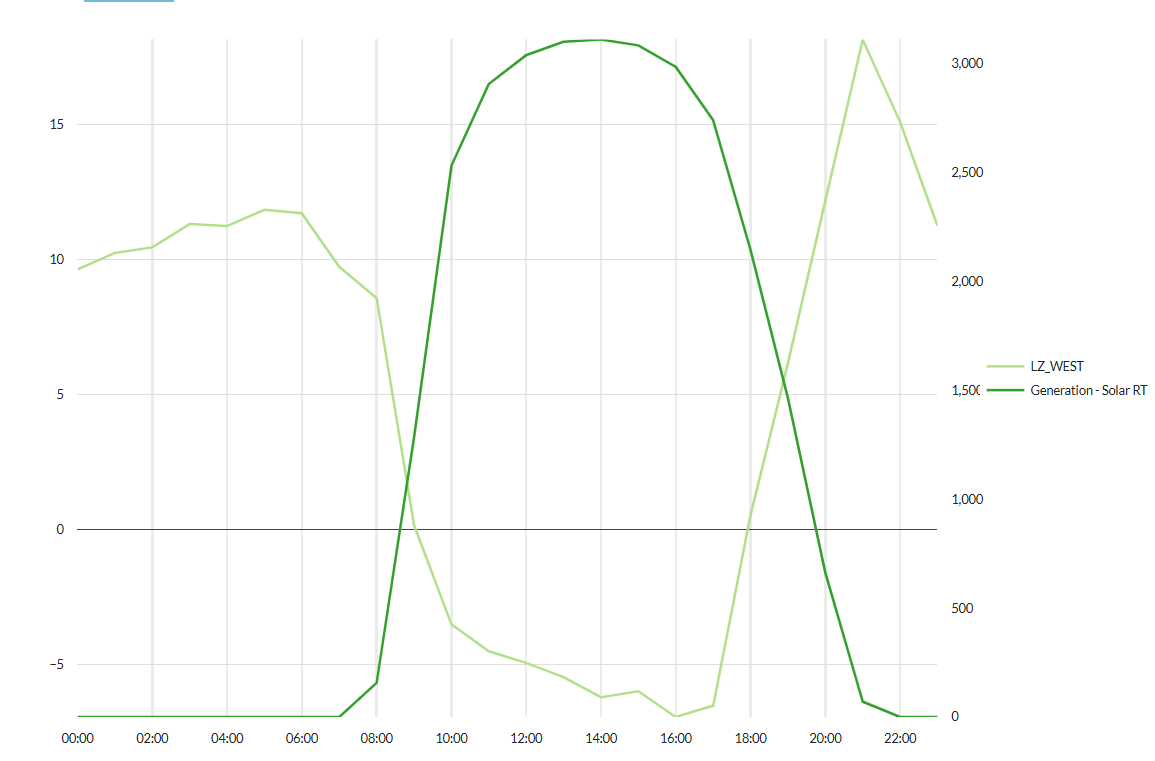
Most of the positive congestion occurred in far West Texas, where the generation mix consists of wind, solar, and thermal resources.
Congestion tended to be positive at night, when solar and gas resources were offline and the region needed to import power. During the day, congestion was negative due to oversupply from local solar and gas generation. The image below shows the average daily congestion and solar shapes in West Texas.
Average Hourly Profiles, LZ_WEST Congestion and Far West Solar, January 2022 to June 2025
Source: Yes Energy’s GridSite
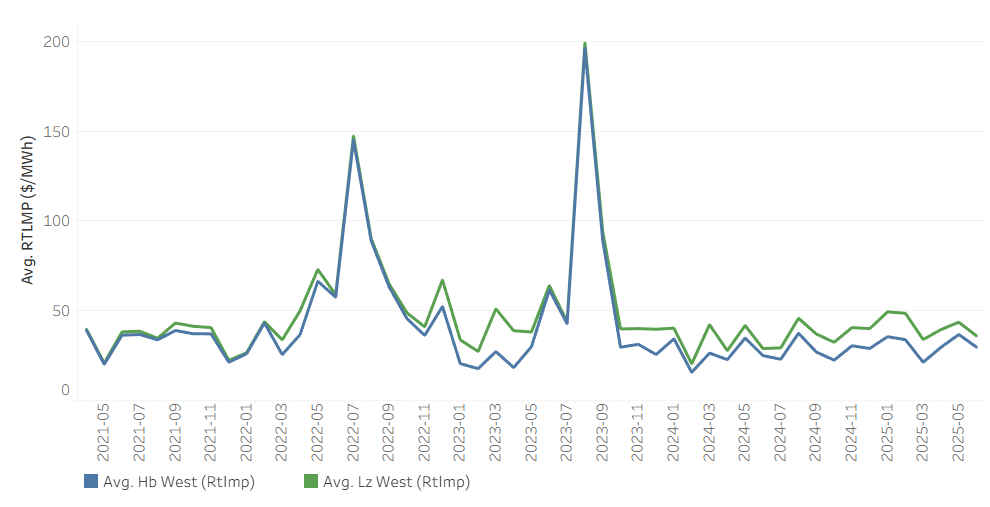
Notably, LZ_WEST congestion has been significantly higher than HB_WEST congestion. This is because LZ_WEST represents a load-weighted average of load nodes, while HB_WEST is a simple average of 345 kV generator nodes.
Intrazonal congestion has disproportionately affected load nodes in the West Zone, leading to higher congestion costs relative to hub pricing, as you can see in the graph below.
ERCOT HB_WEST v. LZ_WEST Monthly Avg. RTLMPs, January 2022 to June 2025
Source: Tableau
Conclusion
As ERCOT continues to evolve, understanding the interplay between power generation trends, transmission constraints, and pricing is critical to stay competitive. The data tells a clear story: increasing renewables and storage are reshaping price dynamics, while congestion is creating new pockets of opportunity and risk.
As we saw in our analysis:
- Excess wind generation primarily drove negative congestion in the South and Panhandle.
- Congestion in the West Zone is more complex, with wind, solar, and thermal resources playing a part.
As the market fluctuates, tools like GridSite allow you to evaluate potential project locations, negotiate PPAs, and conduct long-term market analysis. The ERCOT market isn’t just changing – it’s opening up new avenues for insight and action.
Want to learn more? Download our white paper with a deeper dive into this topic.
To learn more about how this analysis was generated in part by Yes Energy's long-term power forecast, take the interactive tour.
Frequently Asked Questions
Meet the Author