

.png?width=300&name=Blog%20Header%20Image%20(1).png)
Day-ahead traders in ERCOT may have noticed significant congestion since mid-February in the area of Fort Mason, Texas. Split between four different constraints, there have been over $26,000 of shadow prices on the Fort Mason to Yellowjacket transmission line. But what has been driving the congestion, and why are we seeing congestion in both directions (from Fort Mason to Yellowjacket and from Yellowjacket to Fort Mason). Plus, how can traders capitalize on the opportunity this congestion presents?
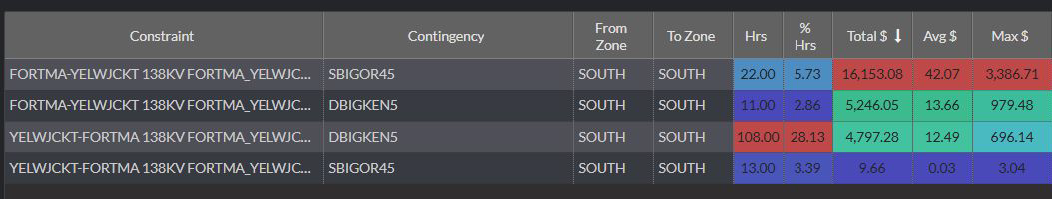
(Source: Constraint Summary Module of Yes Energy’s PowerSignals)
Yes Energy's Outage Constraint Overlap Tool is a great place to start the investigation. By filtering thousands of transmission outages that ERCOT publishes every day down to just line outages that are within 35 miles of the constrained transmission facility and which coincided with congestion, we can quickly identify the Katemcy-Masn 69 kV outage as having a good lineup with the start of congestion on February 19. The Edison-Kendal 345 kV outage also has some overlap with the most significant shadow prices and may help explain the directional switch between constraints.
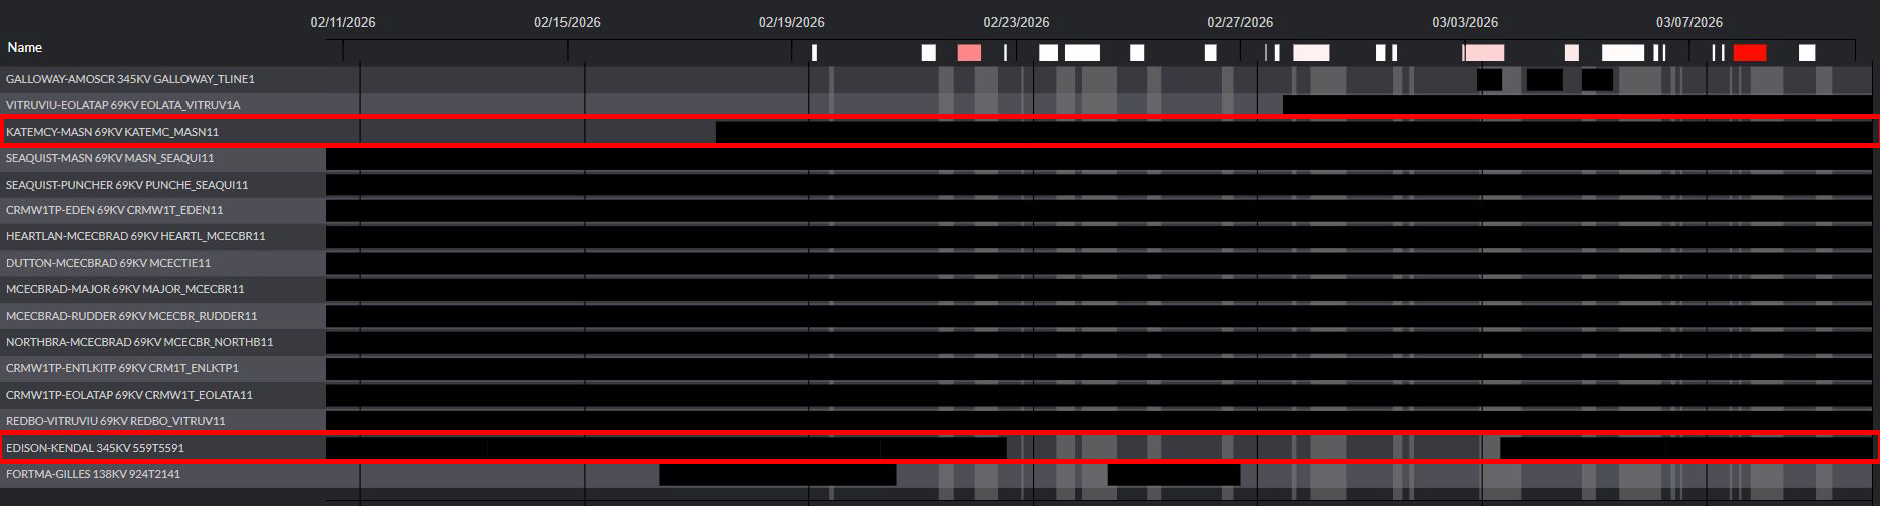
(Source: Outage Constraint Overlap Module of Yes Energy’s PowerSignals)
Taking those constraints and transmission outages to the Time Series Analysis Module helps connect those dots and explain why congestion was not present during all hours of the Katemcy-Masn outages.
With Fortma-Yelwjckt shadow prices in red and Yelwjckt-Fortma shadow prices in blue, we glean a few quick insights. First, both constraints were most active in low solar hours. Second, Fortma-Yelwjckt is most active in hours that also have low west wind while congestion binds in the opposite direction with high wind. And finally, the Edison-Kendal outage seems like it may exacerbate the low wind congestion but is not needed for high wind congestion and may even relieve that congestion.
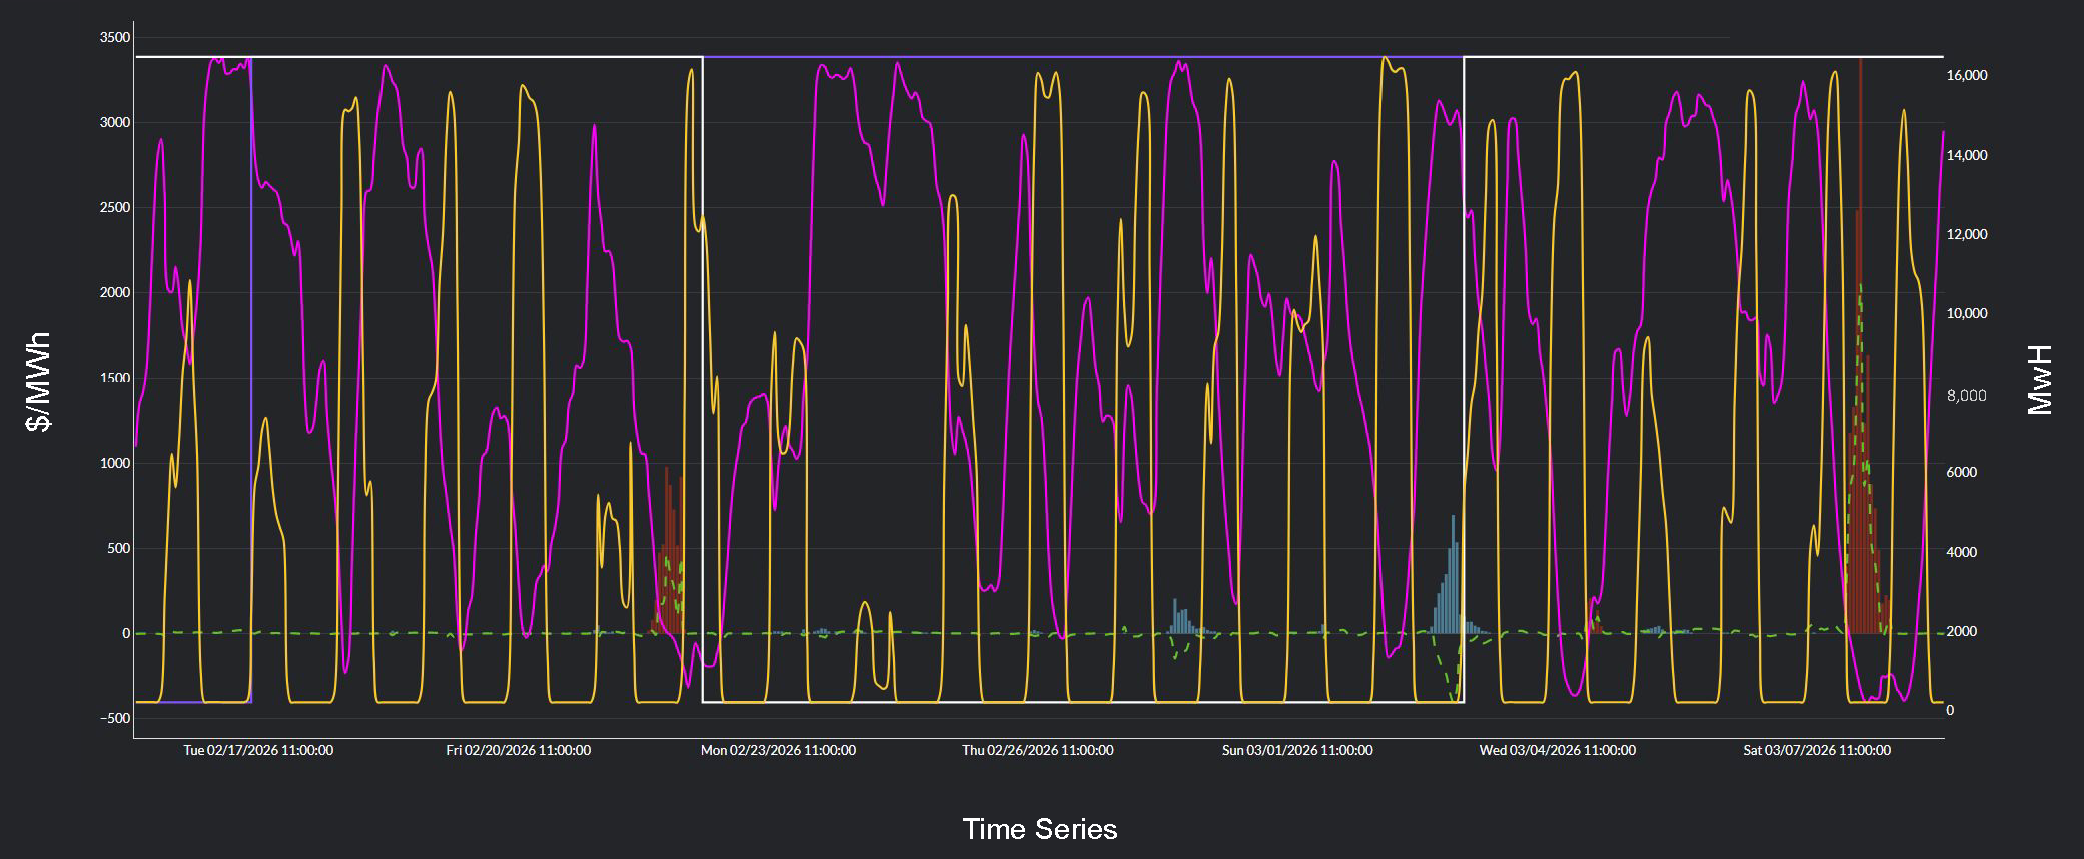
(Source: Time Series Analysis Module of PowerSignals)
Line Key: White = Edison–Kendal outage | Purple = Katemcy–Masn outage | Pink = GR_West wind (MW) | Yellow = FarWest solar (MW) | Green dotted = Junction_RN – Batcave_RN DART spread
So how could day-ahead traders have used this information? Assuming a 10 mW point-to-point trade using Batcave_RN as the source and Junction_RN path as the sink, a trader could have netted over $105,000 by clearing all hours since the Katemcy-Masn outage began where the GR_West wind forecast at the bid submission deadline was below 5500 mW and the FarWest solar forecast at the deadline was below 1000 mW, with $85,000 of that value realized after the outage had already been active for a week.
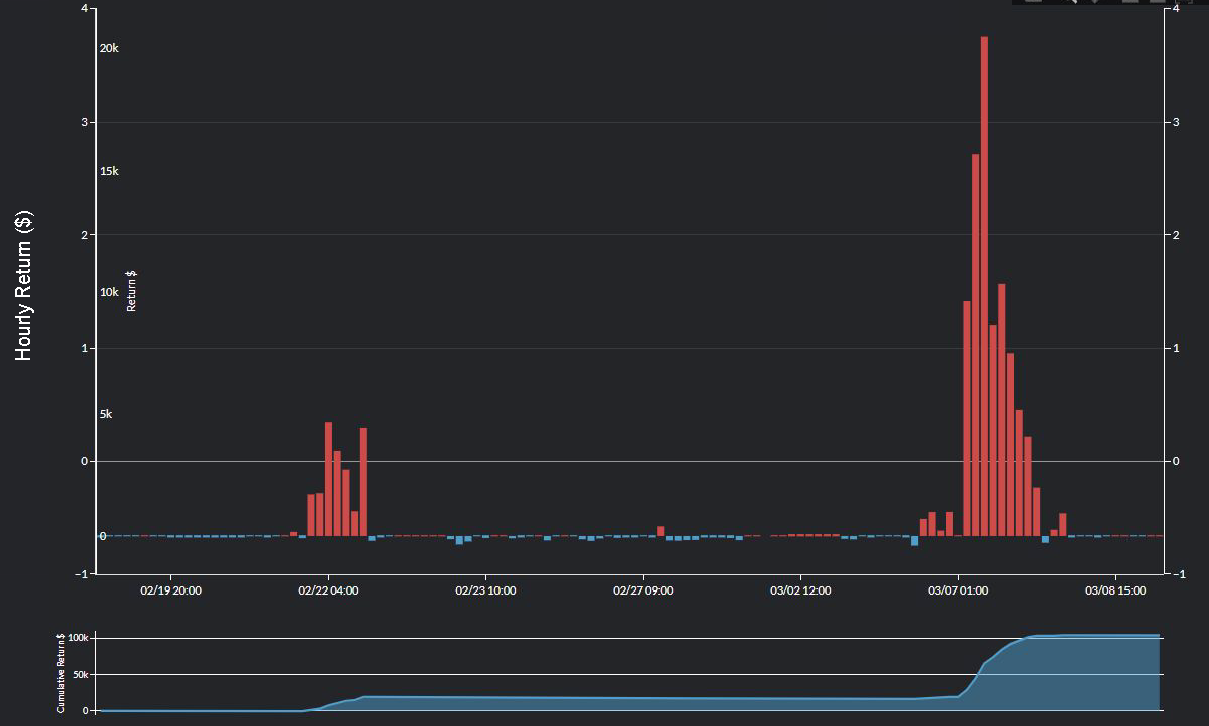
(Source: Nodal Spread Profile Module of PowerSignals)
The Katemcy-Masn outage is currently scheduled to last until May 20 and Edison-Kendal until March 13. If you want the tools to replicate this analysis across ERCOT and beyond, connect with our team for a personalized walkthrough.

Meet the Authors
