

Sometimes the more things change, the more they stay the same. A decade ago, everyone was talking about the approaching saturation of power markets like the California Independent System Operator (CAISO) with cheap renewable energy. The consequences of that trend were alleviated somewhat with the ensuing proliferation of energy storage resources that soaked up the excess renewable generation in times of oversupply and discharged during peaks where power was in high demand. But what happens when the battery market faces the same dilemma? Build enough storage resources to respond to high prices and you may just eliminate the financial conditions needed to make those same resources economically viable.
Recently, Latitude Media highlighted that exact phenomenon playing out in the Electric Reliability Council of Texas (ERCOT) currently. This article inspired me to go digging to see if the market data in CAISO, ERCOT, and other ISOs has an interesting story to tell.
An October Heat Wave Without the Price Spikes
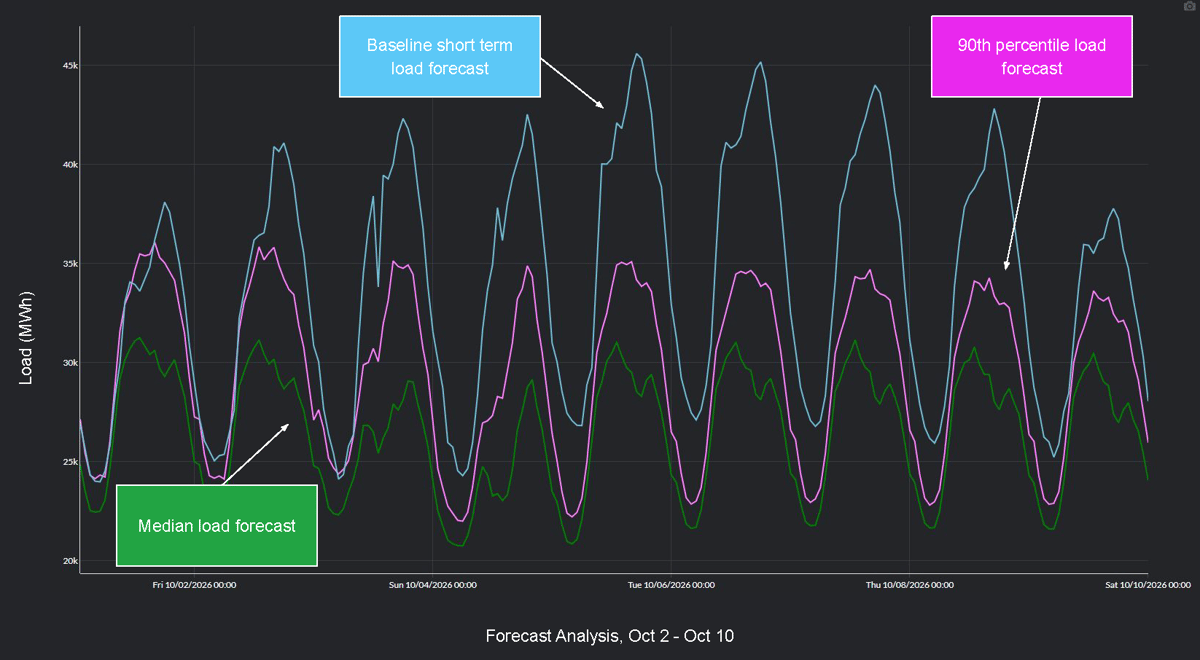
Let’s start in CAISO, which saw power demand levels in early October 2026 rivaling typical summer peaks. Driven by unseasonably warm weather, load peaked just above 46 GW on October 5. To show how far outside the norm that is, the 90th percentile of historical weather conditions in early October would translate to an expected load peak of 35 GW with a median expected load peak of 31 GW. The overall 2026 summer load peak was 49.9 GW on September 9 - less than 10% higher.
 PowerSignals Forecast Analysis Module
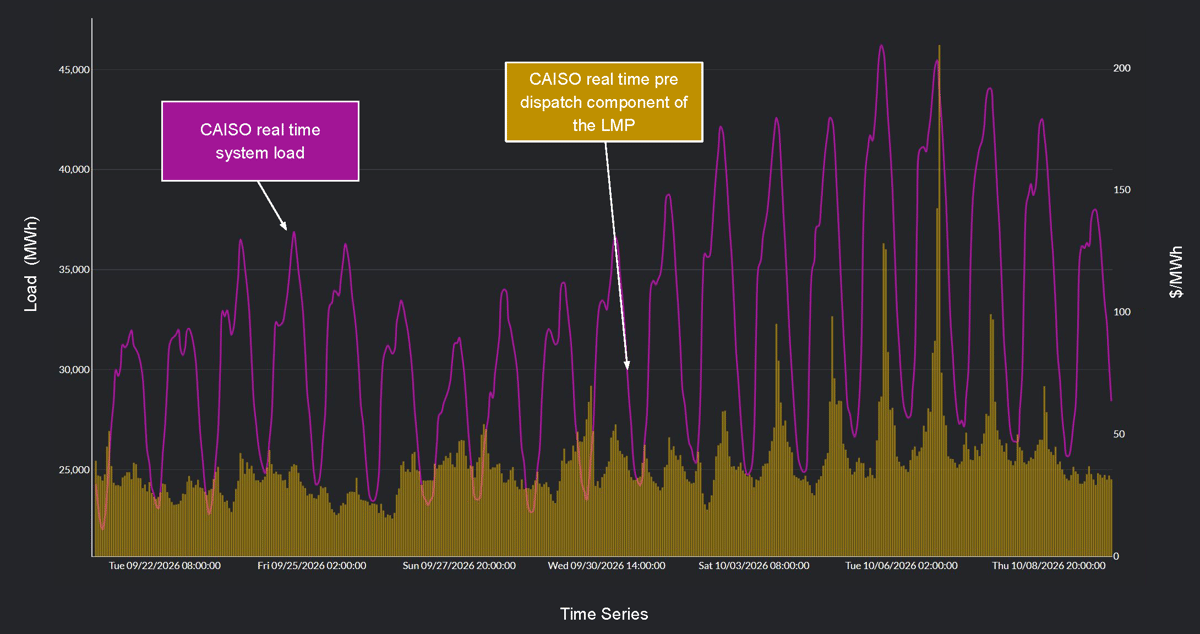
In spite of those unusual conditions, real-time prices were quite muted. Real-time energy peaked at $209.31/MWh on October 6 with most days during the week-long heat wave failing to crack even $100/MWh. This begs the question: why didn't the real-time market experience shortage pricing during a period of anomalously high demand?
 PowerSignals Time Series Analysis Module
The CAISO Correlation: Battery Growth and Fewer Price Spikes
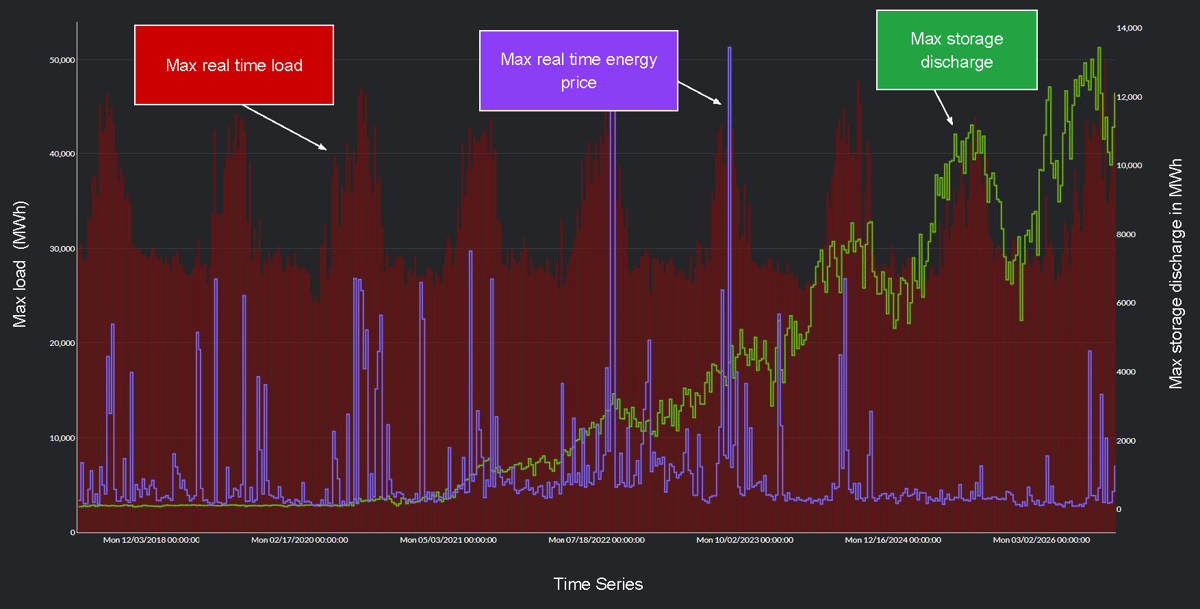
Any major market shift will have multiple contributing factors. Temperature differences, varying levels of hydro generation based on precipitation, and improved coordination with neighboring balancing authorities through the Western Energy Imbalance Market (WEIM) and Extended Day-Ahead Market (EDAM) arguably all play a role in explaining year-over-year differences in pricing dynamics. But an overlay of real-time prices and battery storage growth still provides a stark contrast.
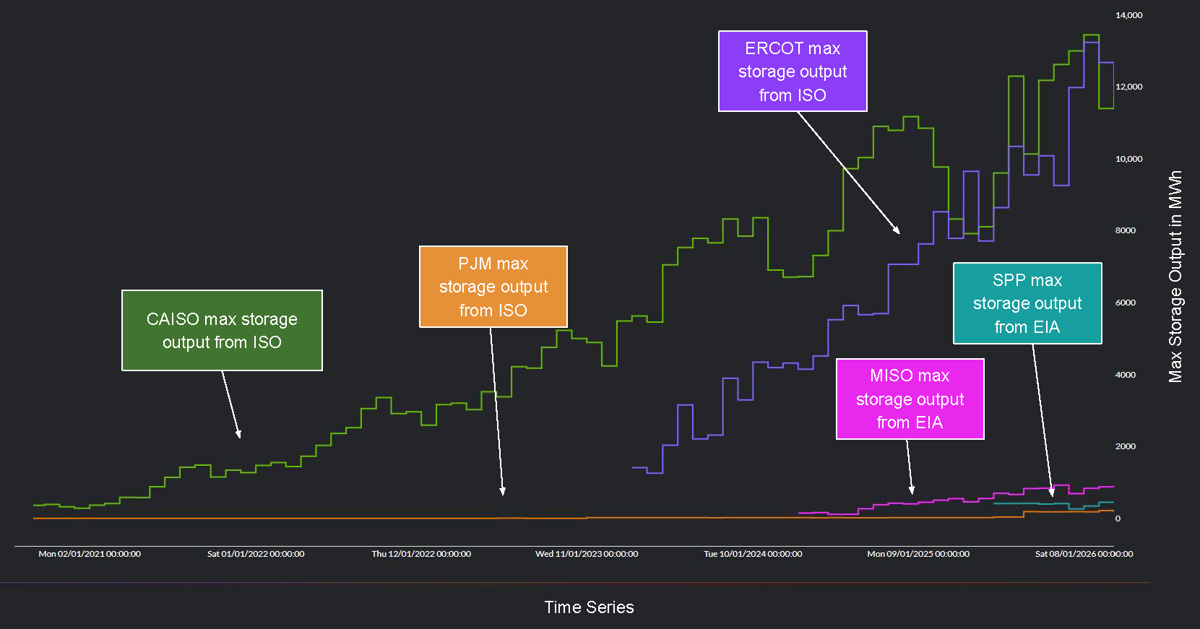
Since 2018, the maximum battery storage discharge in CAISO has risen from roughly 100 MWh to over 13 GWh. At the same time, we have seen a dramatic drop in the frequency and magnitude of systemwide real-time energy price spikes despite load levels remaining comparable or even increasing. From 2019-2023 there were 24 days with real-time energy prices above $800/MWh, including 6 days with prices over $1400/MWh (CAISO caps energy offers at $2000/MWh). That averages out to almost five days per year with extreme real-time pricing. Since 2025, there have not been any days with real-time energy prices above $700/MWh and only 3 days with peaks above $250/MWh (there were 109 such days from 2019-2023). Correlation is not causation, but the correlation still jumps out.
 PowerSignals Time Series Analysis Module
ERCOT: Later Start, Similar Pattern
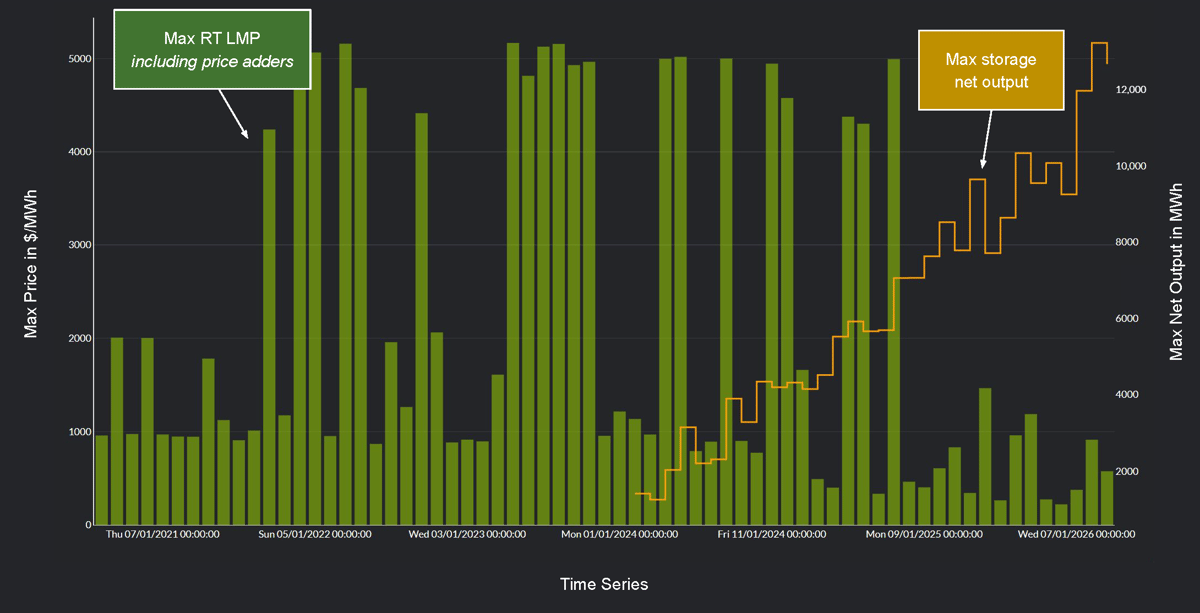
The growth of energy storage resources in ERCOT started much later with peak discharge of only 1.4 GWh in early 2024. That shorter time horizon makes it tougher to filter out potentially confounding variables, but it does appear that real-time price spikes have become less extreme and less frequent since available battery assets crossed the 7.5 GW threshold. From March 2021 through September 2025, there were 110 days where the HB_BUSAVG node saw a peak real-time locational marginal price (LMP) inclusive of price adders above $1000/MWh including 46 days with a peak LMP over $3000/MWh. Since September 2025, there have not been any spikes above $1500/MWh and only 13 days with prices over $500/MWh.
 PowerSignals Time Series Analysis Module
What This Means for Battery Revenue
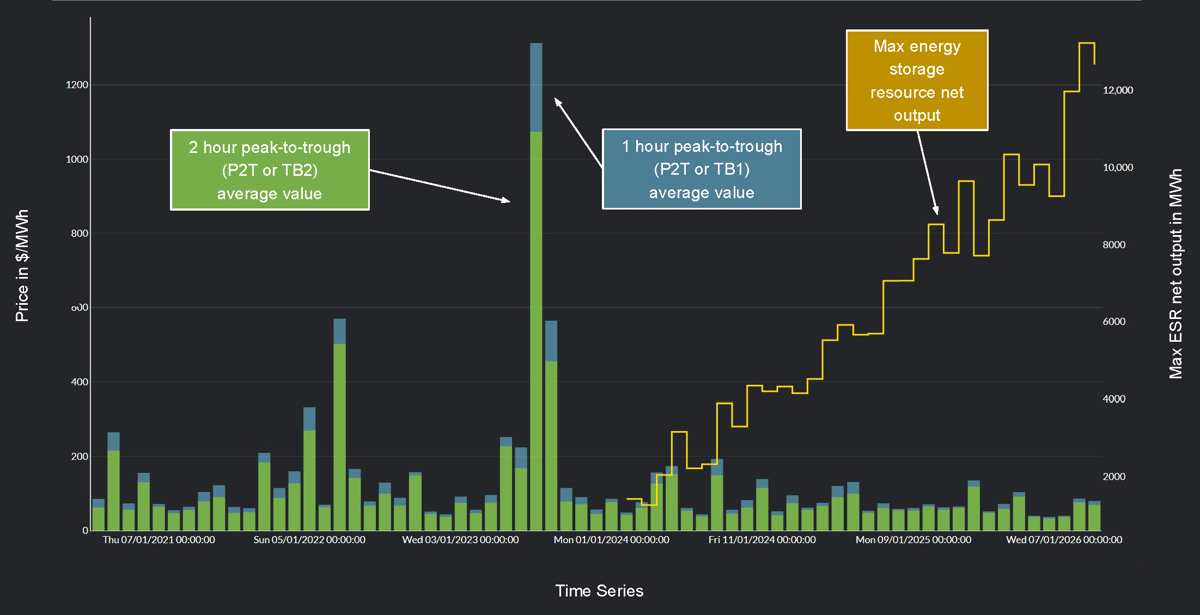
We can use a peak to trough calculation which assumes that a battery charges in the lowest priced hours of the day and discharges in the highest priced hours of the day with perfect roundtrip efficiency to translate real-time price shifts into battery asset revenue. Using the HB_BUSAVG node as a system proxy, both a one-hour and two-hour duration energy storage resource (which accounts for most of the installed capacity in ERCOT) saw potential energy market revenues more than double between March 2021 and the end of 2023. Since 2023, maximum battery storage discharge levels have grown to over 13 GW and we have seen a corresponding drop in peak to trough values to levels that are 25-30% lower than their starting point in 2021. This does not include revenue from ancillary services, but as Latitude's investigation notes, those prices have seen a dramatic drop off as well
 PowerSignals Time Series Analysis Module
Will Other ISOs Follow?
How is this phenomenon playing out across the country? To date, no other market has hit an inflection point in the growth of battery storage resources. The Midcontinent Independent System Operator (MISO) saw a peak battery discharge of 922 MWh in 2026 while the Southwest Power Pool (SPP) and PJM have both stayed below 500 MWh. While it took CAISO approximately three years to go from 1.5 GW to 7.5 GW of battery power, ERCOT achieved the same growth in just 18 months which could portend similarly rapid growth elsewhere. Adjustments are also needed to account for relative market size, and the significant difference between peak load in MISO and PJM versus CAISO or ERCOT means those markets may be able to absorb more capacity before reaching a saturation point.
 PowerSignals Time Series Analysis Module
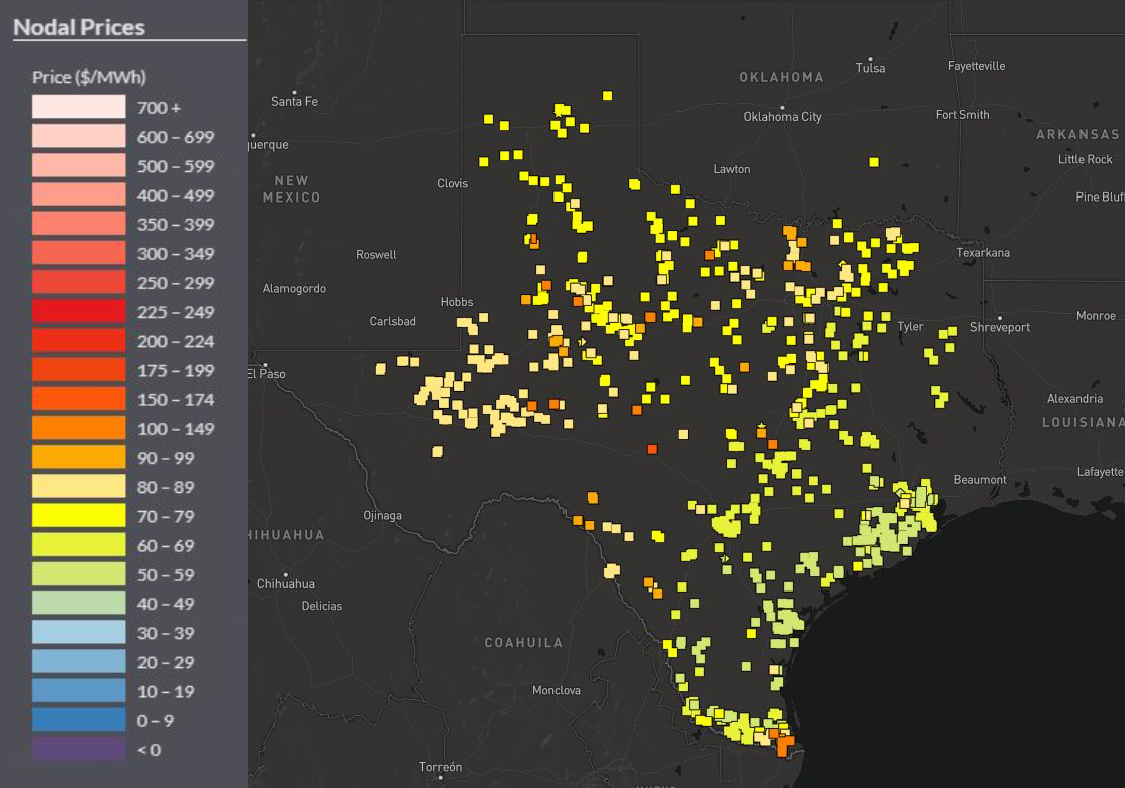
It would be easy to conclude that the opportunity for battery developers is drying up, but I would argue that there is still room for savvy builders and operators who understand nodal pricing dynamics rather than relying on marketwide trends or looking at land availability before analyzing project economics. In the first nine months of 2026, the average peak-to-trough delta for a two-hour duration storage project in ERCOT was just $34,632 per MW of installed capacity. However, when we look at specific locations, 101 price nodes were on pace for annual revenues of at least $62,064 per installed MW — in line with the system wide two hour peak to trough values in 2021 — with 20 nodes potentially exceeding $73,781 per MW. The emergence of extreme real-time price spikes during generator outage season like we saw in PJM and MISO on October 13 could also change the economic calculus going forward.
 PowerSignals Long Term Price Map Module
Looking Ahead
Looking ahead to 2030-2034, Yes Energy's proprietary nodal forecast projects eight nodes in ERCOT with potential annual revenue for a two-hour duration project above $78,073 per installed MW in our equilibrium scenario. The golden era of 2022-2023 may be gone, but that doesn't mean storage is dead in the water. Capturing the available opportunity will require understanding localized congestion drivers at a detailed level rather than simply hedging risk with financial products like bilateral swaps, point-to-points (PtPs) or congestion revenue rights (CRRs).
For asset developers or operators already tied to a specific location, Yes Energy's Market Data Platform can give you the historical data, real-time grid condition monitoring, proprietary forecasts, and visual analysis tools you need to understand and act on those price signals that make the difference between profit and loss.
Interested in learning more? Request a demo.