Share this
by Gaby Flores
By now most of the world knows about the cold snap in ERCOT the week of 2/15/21 (if not, check out our blog post here), but do you know the generation side of the story? You may know some of the story from watching the news, like we have - including claims that it was a wind issue or a natural gas supply issue.
History tells us that it will take months to determine the root causes of this event, but what was the data telling us in real-time during the crucial hours and minutes leading up to the event? Traders with access to market data in Yes Energy alongside real-time generation data from Live Power had critical insight into the generation side of this story. What happened and what role did generation play in this historic week in ERCOT?
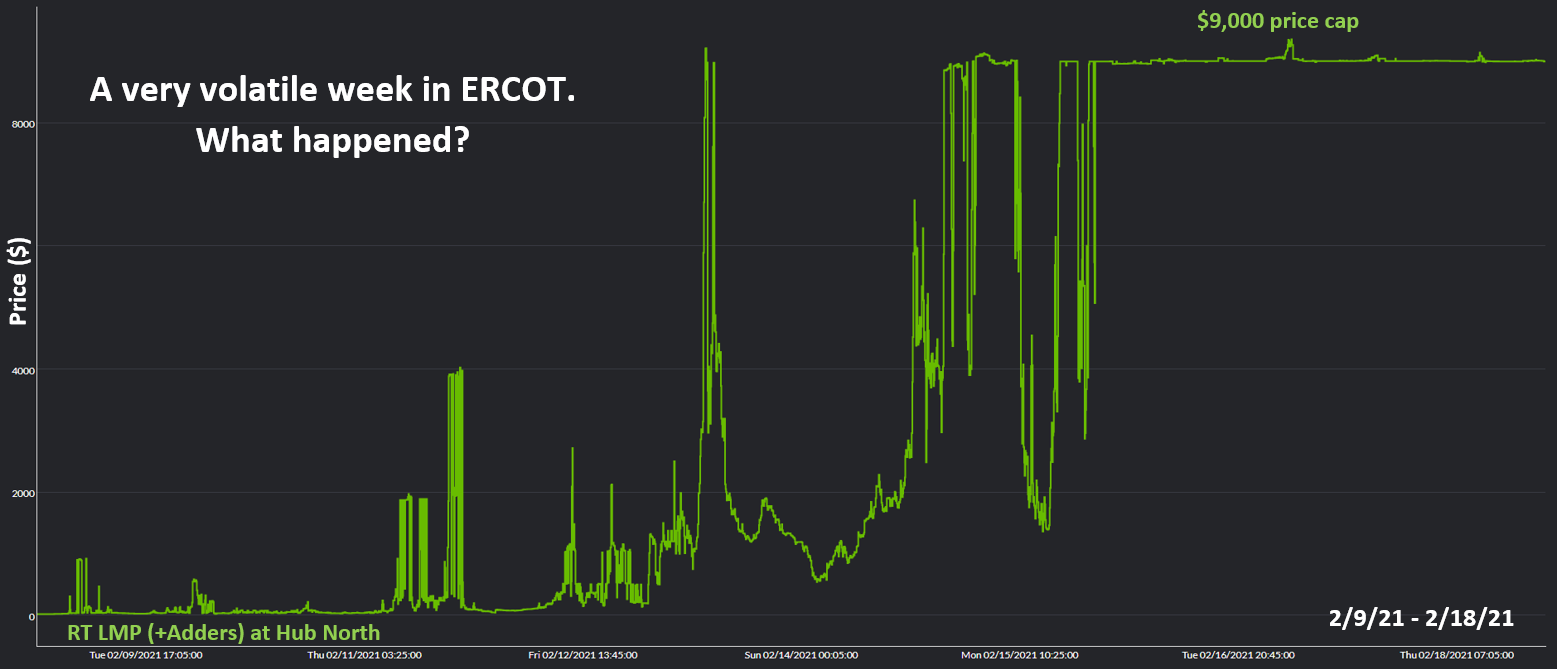
First, prices in ERCOT were at their market cap of $9,000 per MWh for days on end the week of 2/15/21. This was not price node or load zone specific, this was system-wide in ERCOT for many hours and many days on end. The chart below shows the real-time LMP (with scarcity adders) at Hub North in ERCOT from 2/9/21-2/18/21, but this could have been any price node in ERCOT that week because this cold snap had system-wide implications.

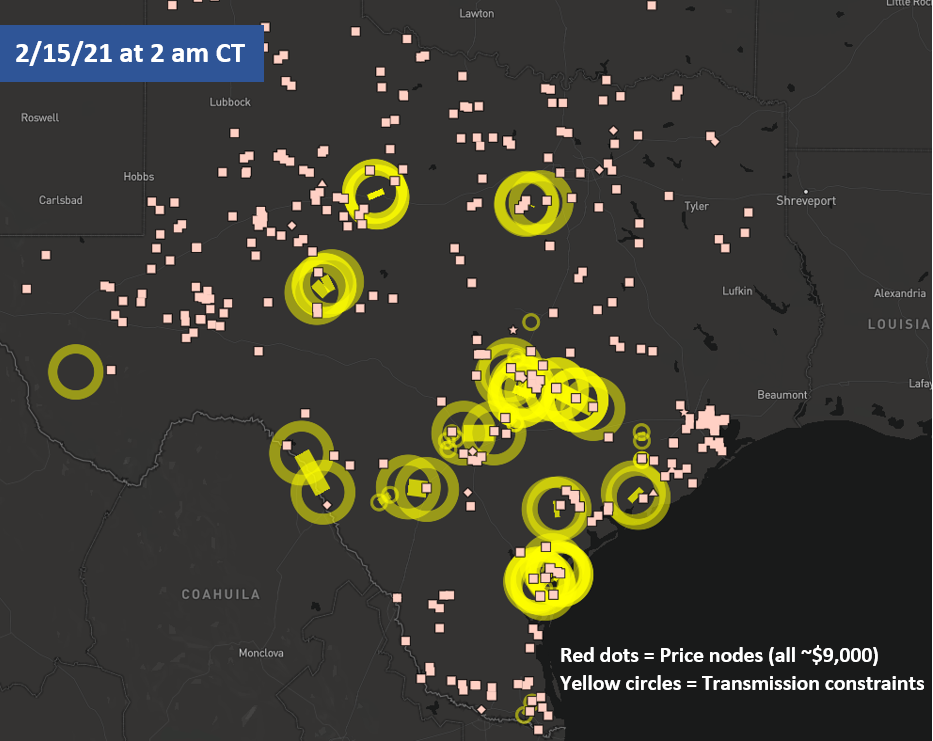
The map below is a snapshot from 2/15/21 at 2 am from Yes Energy’s PowerSignals product that provides a visual representation of the high prices throughout ERCOT and the pervasive transmission constraints. In this visual, all of the red dots are price nodes in ERCOT (all are at or around the market cap of $9,000 per MWh) and the yellow circles & lines are transmission constraints binding in the real-time market. It is worth noting that during this time, as well as throughout the week of 2/15/21, ERCOT was in an Energy Emergency Alert Level 3 (EEA3), which is due to an imbalance of supply & demand, thus rolling blackouts are required.

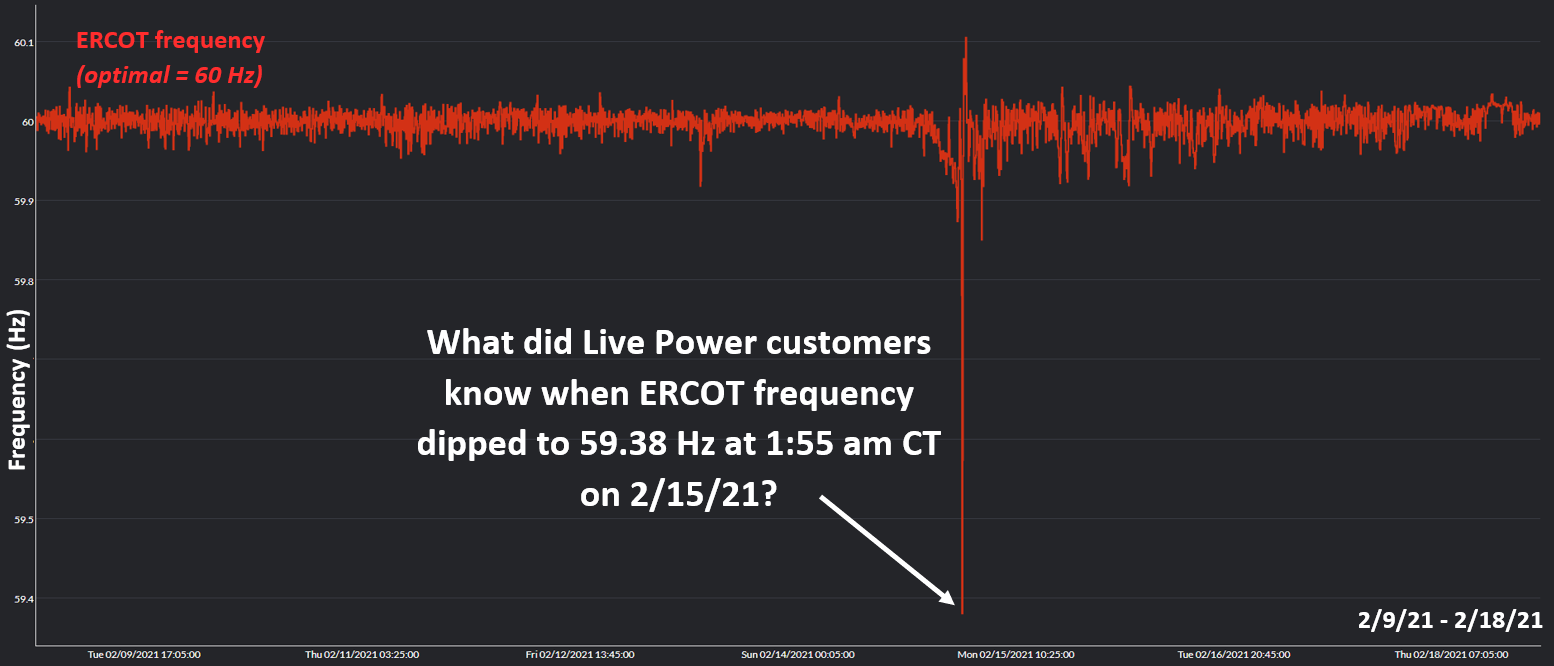
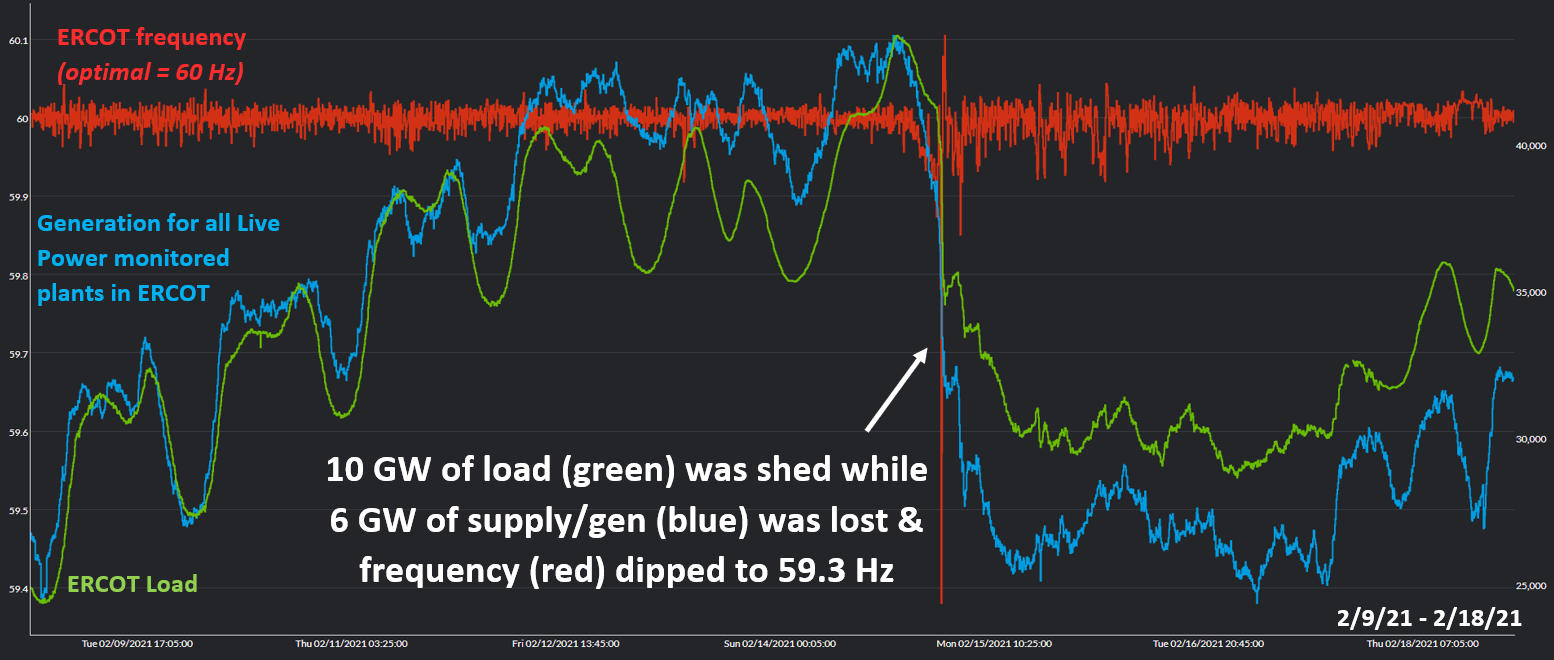
What happened right before this in the wee hours of 2/15/21? At 1:10 am CT Live Power data gave an early indicator of generation decay. This gave Live Power customers 45 minutes to react prior to 1:55 am CT when ERCOT frequency, which is the heartbeat of the grid (60 Hz is a normal beat) suddenly dipped to 59.38, which is significant. Had it dipped lower than that there could have been cascading blackouts across the entire state, which would have taken days or weeks to bounce back from. What led to this dip in frequency and what critical insight did Live Power customers have?

At the same time as ERCOT frequency dipped, there was a 6 GW loss of generation across all of Live Power’s monitored plants in ERCOT. What does that mean?
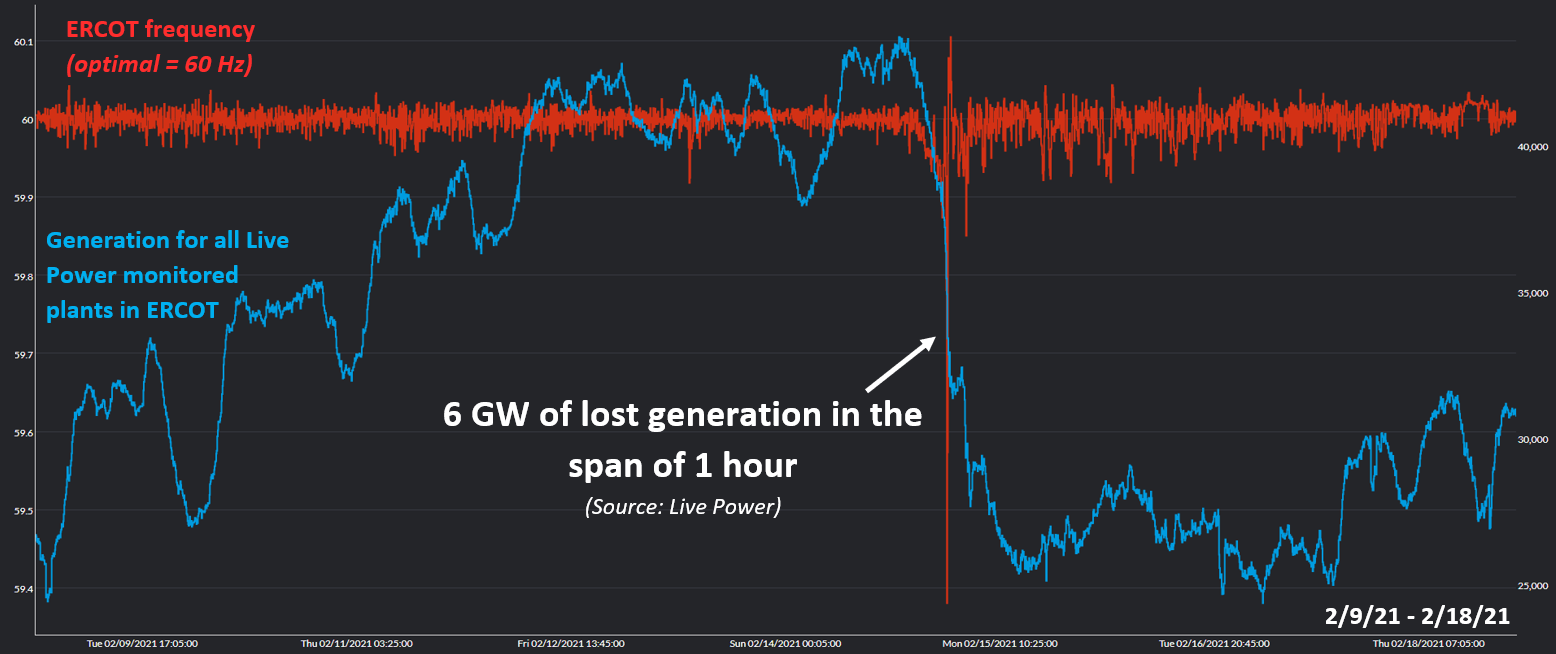

It means that ERCOT needed to shed load, and shed it fast because balancing load and supply on the grid is absolutely critical for the security and reliability of the grid. As seen below, shortly after the loss of generation, ERCOT quickly shed 10 GW of load to regain balance on the grid. This meant far reaching blackouts across the state.

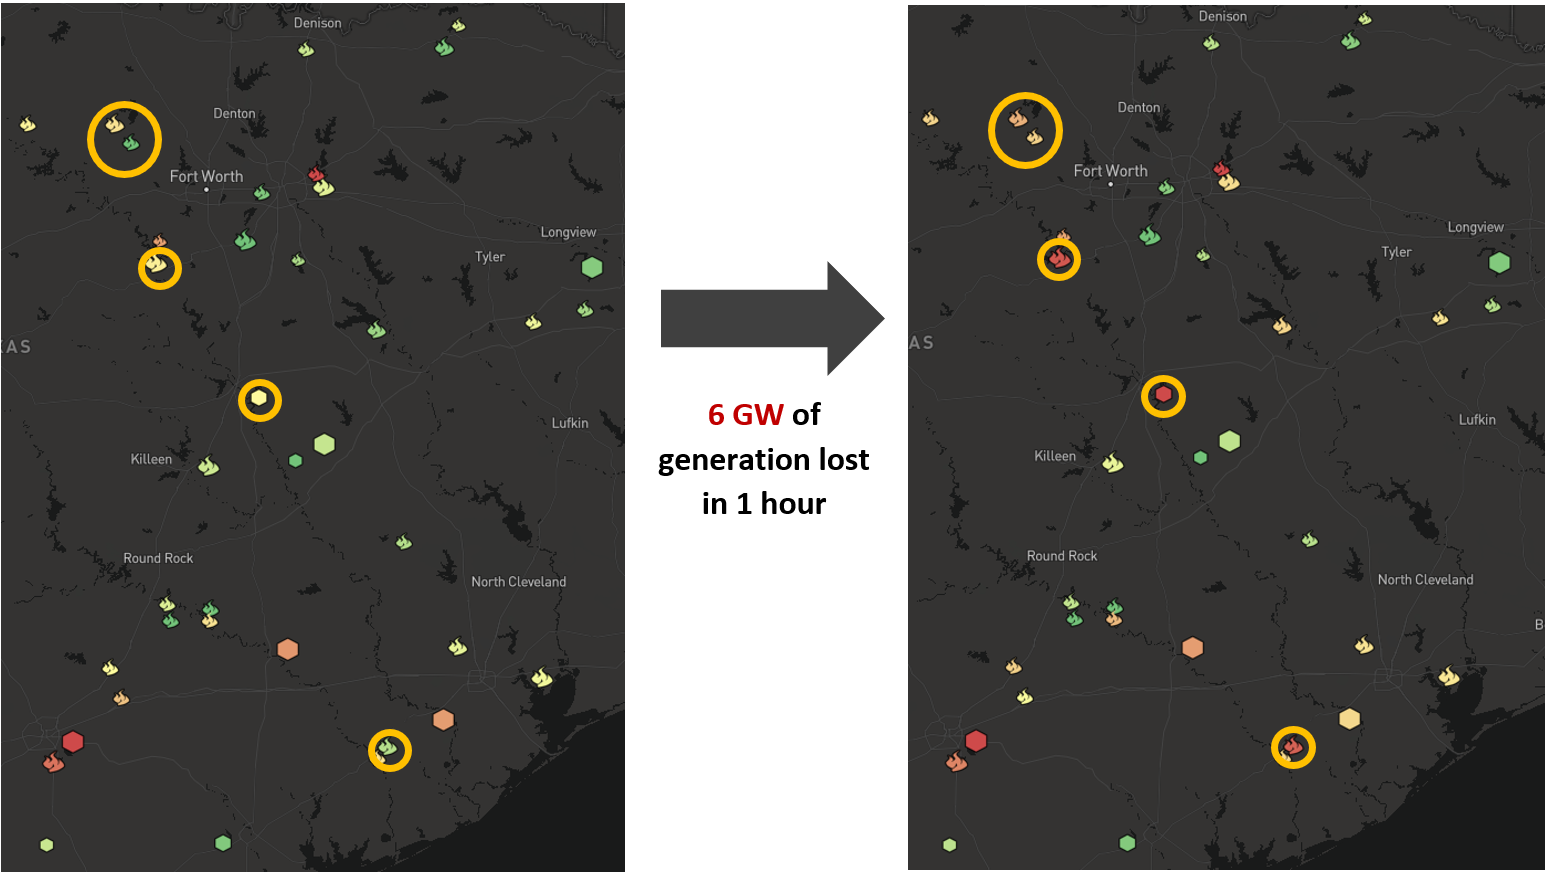
What did Live Power customers know about this loss in generation? Within 60 seconds of this loss in generation, Live Power customers not only knew the relative magnitude of the lost generation, but they also knew the part of the supply stack that was affected, as well as which plants tripped offline. Circled in yellow below are the gas and coal facilities that Live Power monitors that had a sudden loss in generation at 1:55 am, which lead to the dip in frequency and the subsequent shedding of load. This sudden loss of generation was partially due to the widespread natural gas issues that were caused by the historic low temperatures across the state. For example, critical parts of the gas supply chain were freezing (valves, pipes), electric motors could not run due to the power outages, and there were compression losses throughout the system due to the cold temperatures.

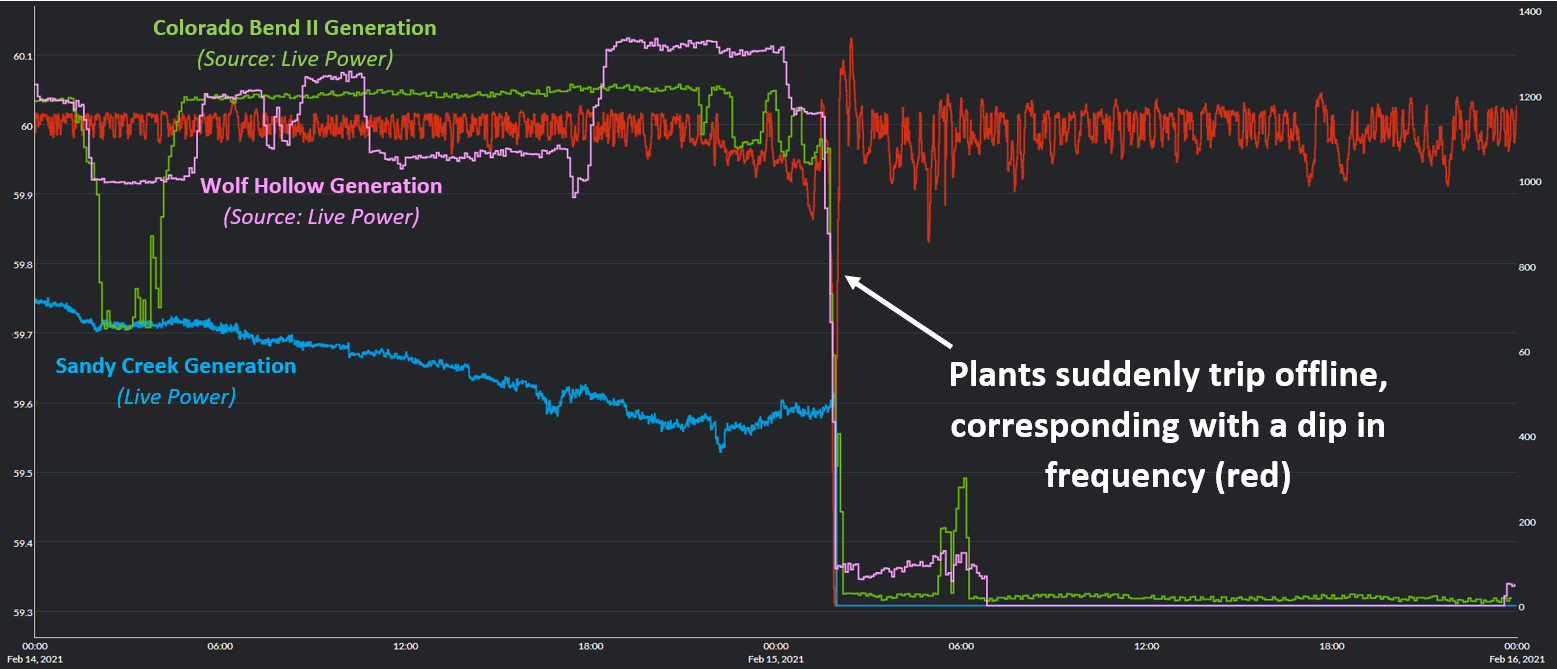
Drilling into the Live Power monitored plants that suddenly tripped offline at 1:55 am, the chart below hones in on three plants in particular that contributed to this decay in generation, which in turn led to a decay in frequency. The green line is Live Power generation data for Colorado Bend II, the blue line is the Live Power generation data for Sandy Creek, and the pink line is Live Power generation data for Wolf Hollow. All of this generation data comes from Live Power and is piped into the Yes Energy platform every 60 seconds. Yes Energy and Live Power customers were able to layer this generation data in context with market data like frequency, which gave them critical insight during this historic week in ERCOT.

Summary
In summary, Live Power data, alongside Yes Energy market data is absolutely crucial for understanding the market dynamics that led to this historic week in ERCOT. This critical insight does not end here, Live Power customers will have an early indicator from Live Power’s 60 second generation data as power plants return to normal operation as temperatures warm up. Don’t wait for the next historic event, sign up below for a demo of the Yes Energy and Live Power data used in this analysis.

If you’d like to get our latest and greatest blog posts, including our periodic Market Driver Alerts.